You're usually not looking at Core Web Vitals because you're curious. You're looking at them because a page that used to feel fine now drags on mobile, the field report has more yellow than green, and someone wants to know whether the fix is worth engineering time or just a nice-to-have. That's the right question to ask. How to improve Core Web Vitals starts with deciding what deserves attention, not with memorizing a list of tactics.
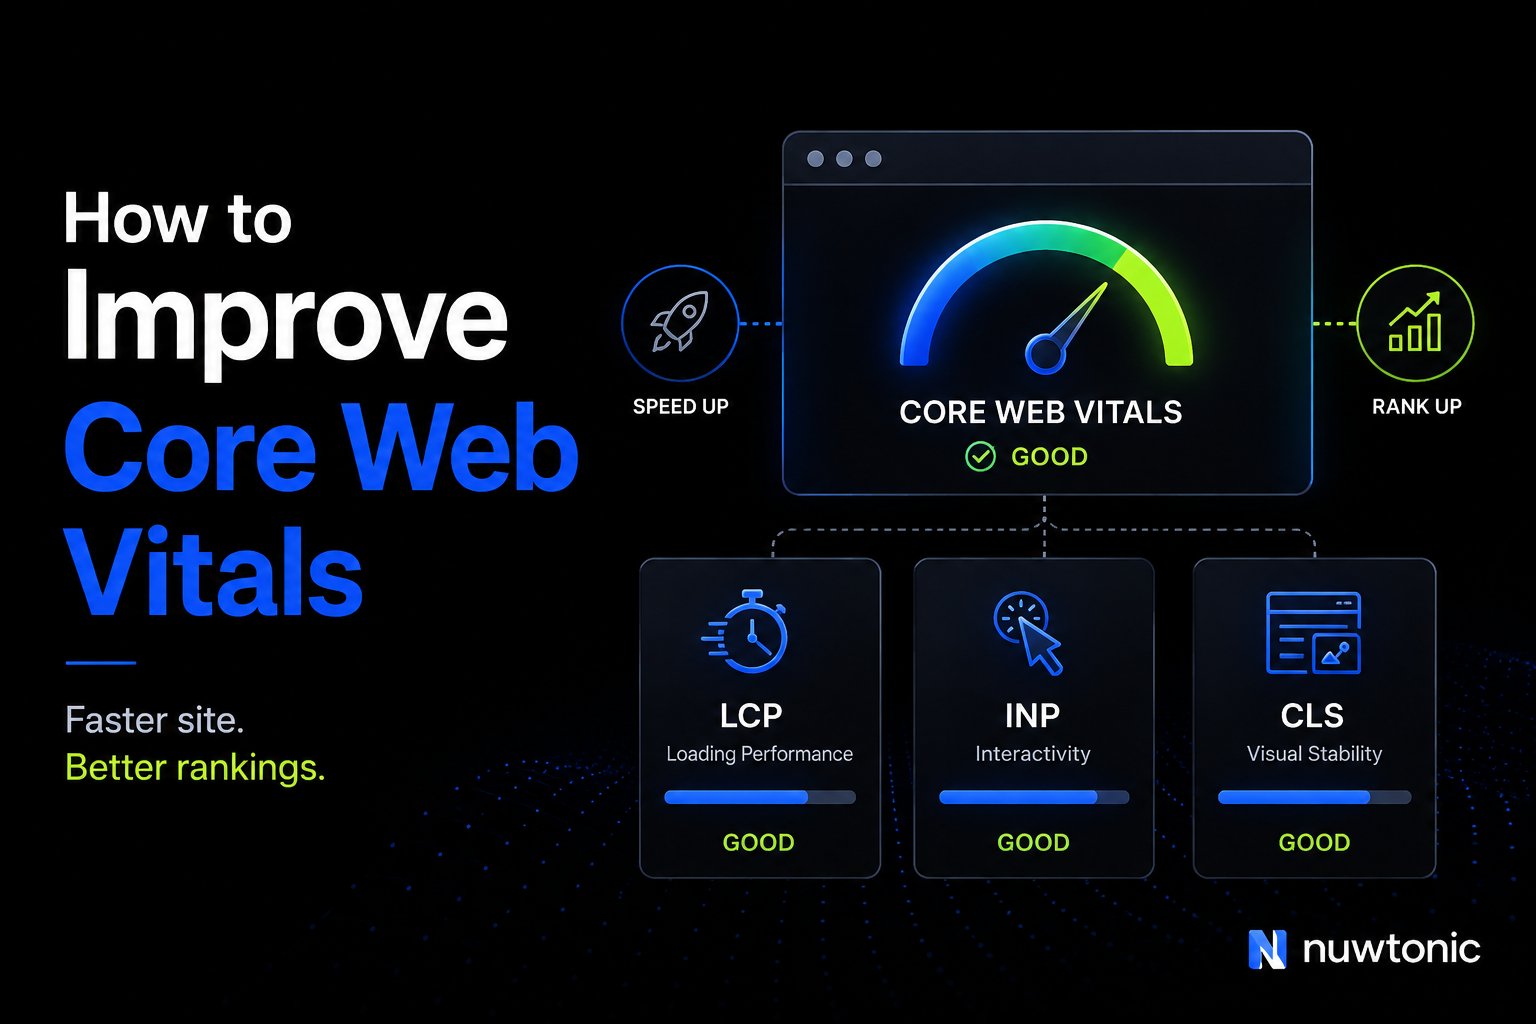
Google's three official thresholds are clear. LCP should be under 2.5 seconds, INP under 200 milliseconds, and CLS under 0.1 for a good experience, with pages above those levels moving into needs improvement or poor categories according to Google's Core Web Vitals documentation. Google's Core Web Vitals guidance gives you the benchmark, but it doesn't tell you which pages to fix first or which fixes are worth the sprint. That's where most generic guides fall apart.
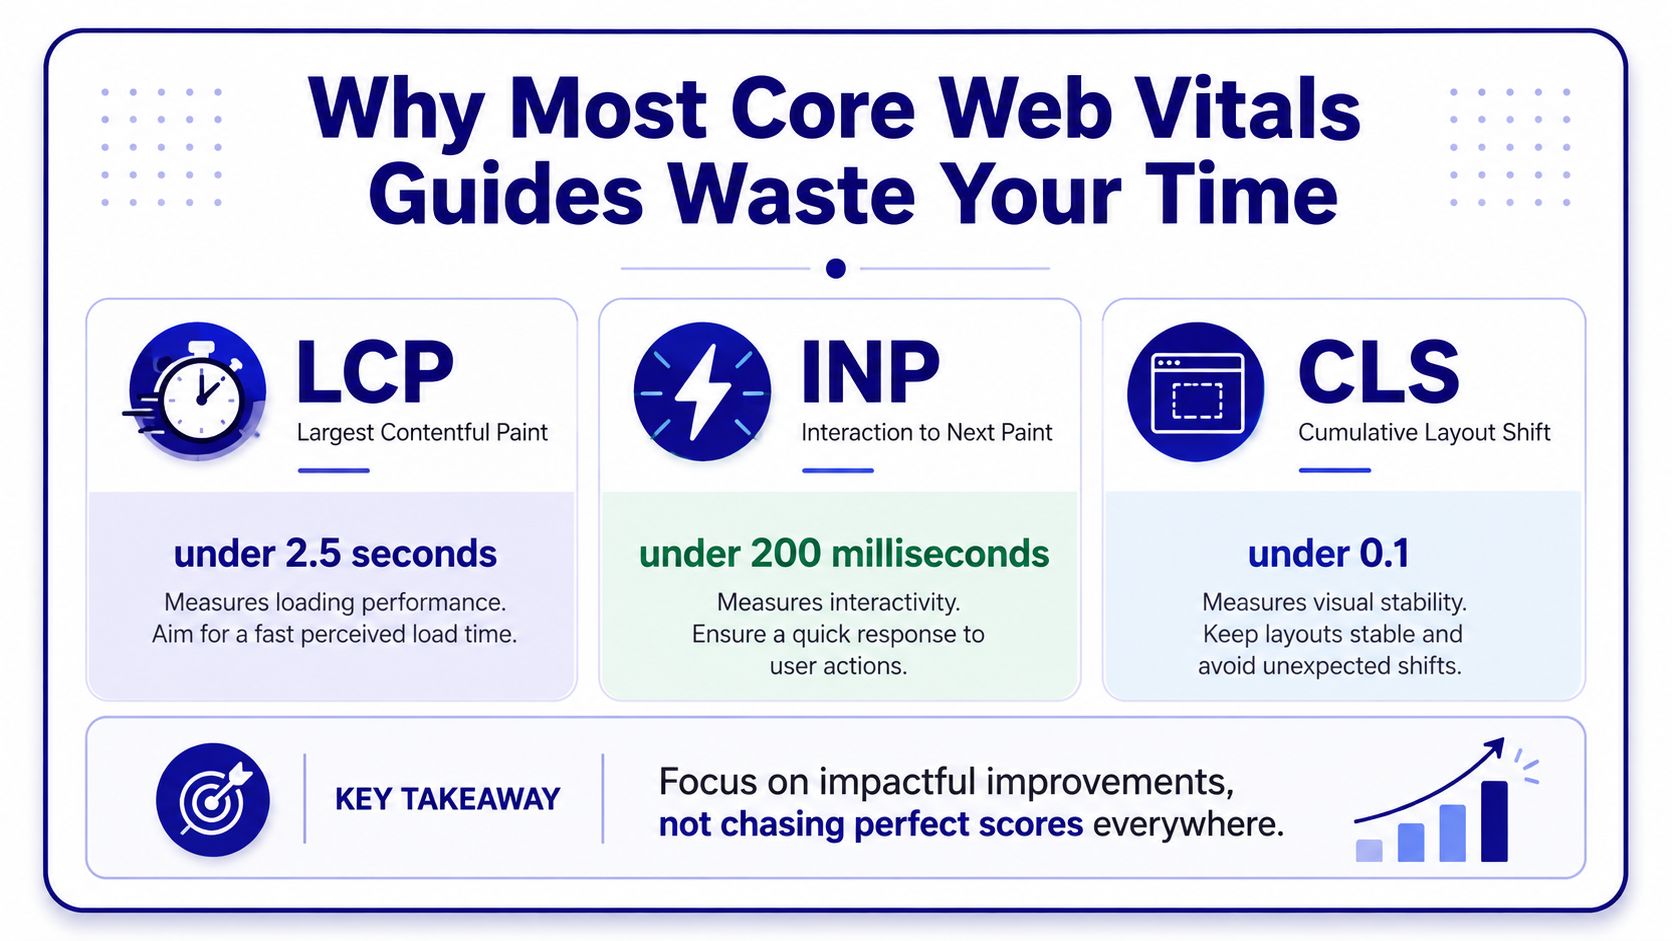
Table of Contents
- Why Most Core Web Vitals Guides Waste Your Time
- Diagnosing Which URLs to Fix First
- Fixing LCP From the Server Up
- Cutting INP by Reducing Main-Thread Cost
- Eliminating CLS With Layout Reservations
- Monitoring CWV as an Ongoing Loop
- Mistakes to Avoid When Shipping CWV Fixes
Why Most Core Web Vitals Guides Waste Your Time
The official targets are simple, but the work is not. LCP under 2.5 seconds, INP under 200 milliseconds, and CLS under 0.1 are the guardrails, not the finish line, because a perfect score on every URL rarely matters as much as fixing the pages that carry traffic, leads, and revenue. Core Web Vitals fit into the wider page experience picture, and useful content still matters more than polishing every template into a trophy.
The practical question is not “how do I make the dashboard all green.” It is “which URL groups should get engineering time this week, and which fixes will move user behavior or rankings enough to justify the work.” That is a different problem, and it calls for prioritization, not obsession.
Practical rule: If a page is already in the green field-data band and does not drive meaningful business value, leave it alone and spend the effort where the gap is visible.
A useful playbook also has to separate ranking impact from ROI. Sometimes Core Web Vitals work helps rankings a little, sometimes it mainly improves engagement and conversion, and sometimes the better move is fixing content intent or internal linking before touching performance code. Google's own guidance frames CWV as part of an ongoing diagnose-optimize-monitor loop, which is why this topic should be treated like operational maintenance, not a one-time cleanup. web.dev's CWV workflow guidance is a better mental model than a speed checklist.
This article focuses on the part most guides skip. You get a triage sequence for deciding what to fix first, a code-level map for the three metrics, and an honest view of which changes are usually low-impact. If you want a broader tactical reference after this, the Core Web Vitals optimization tips from DOM Studio are a useful supplemental read, but the main value here is knowing what deserves your time in the first place.
Diagnosing Which URLs to Fix First
Search Console should be the first stop, not Lighthouse. The Core Web Vitals report groups URLs by status, metric, and similar page types, which makes it the fastest way to spot where field users are struggling. Start by looking at the failing groups by device type, then separate the problem by metric so you're not mixing an LCP issue on product pages with a CLS issue on article templates. That separation matters because each one points to a different kind of fix.
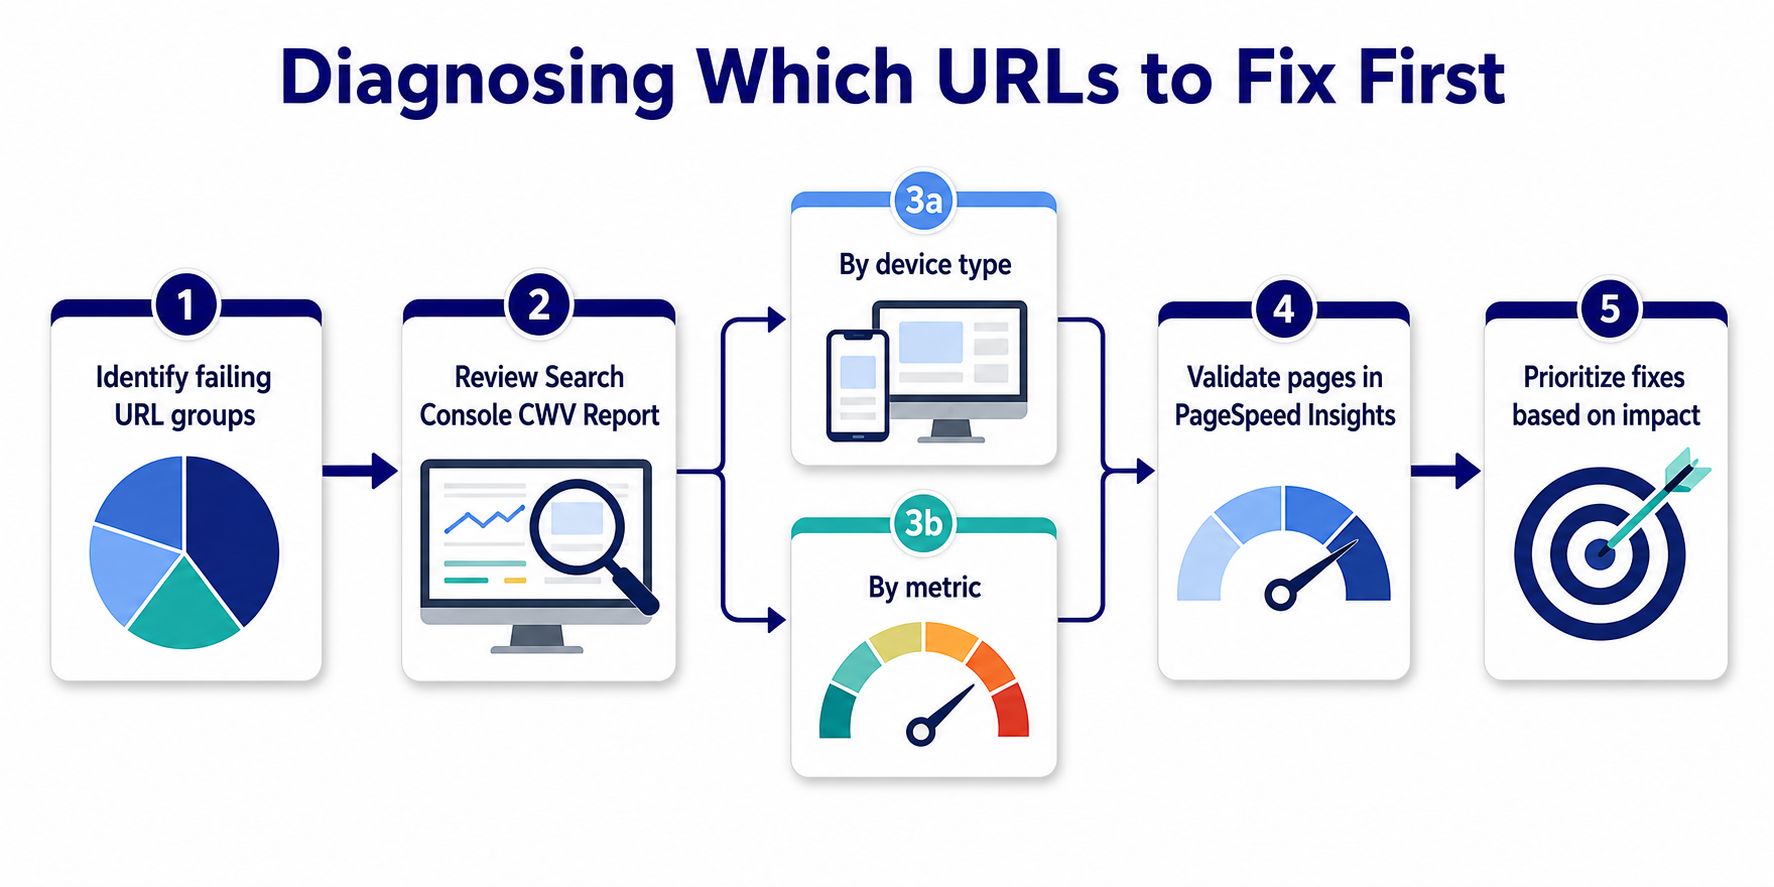
Search Console's data is a rolling 28-day average, so it won't react instantly to a deployment. That makes it better for seeing whether a problem is real and persistent, not for judging a hotfix you shipped yesterday. Once a URL group looks unhealthy in Search Console, validate a representative sample in PageSpeed Insights and then open Chrome DevTools Performance to see what's blocking render or interaction. The key is using lab tools to explain field behavior, not replace it.
A simple triage rule works well in practice:
- Fix this sprint: URL groups with clear traffic or conversion value, repeated failure across many URLs, and a narrow technical cause like a hero image, render-blocking stylesheet, or long main-thread task.
- Fix with a quick patch: pages where the issue is localized, such as missing image dimensions, oversized media, or one third-party widget that's shifting the page.
- Defer for now: low-traffic URLs, pages already sitting in the green field-data band, or pages where the visible issue is small enough that other revenue work is a better use of time.
That workflow becomes even more useful when you compare a single template's field data with a single sampled URL in PSI. If the lab test looks great but Search Console still shows failures, the issue is often mobile network conditions, third-party execution, or a template that behaves differently in production than in a clean test environment. For a tighter “which pages first” framework, the internal guide on which pages should I optimize first from GSC lines up well with this approach.
Field data tells you where users are hurting. Lab data tells you why.
The fastest weekly habit is boring but effective. Review failing groups in Search Console, spot the highest-value template, validate it in PSI, and inspect the page in DevTools before anyone writes code. That keeps engineering focused on URL groups that can change business outcomes, not on pages that only look bad in a synthetic test.
Fixing LCP From the Server Up
LCP usually doesn't fail because of one big front-end mistake. It fails because the page spends too long waiting on the server, then too long rendering the part the user came for, then too long fetching the largest visible asset. The order matters. If the server is slow, every other optimization is carrying dead weight.
Start with TTFB and delivery
Treat Time to First Byte as the first bottleneck to remove. Edge caching, CDN configuration, HTML compression, and reducing server response work all help the browser reach content sooner, and modern CDN guidance consistently points to TTFB as the starting point for improving LCP. Fastly's 2026 material also notes that image optimization at the edge and API design can improve delivery, which is why server work pays off before you touch visual polish. Otter A/B's LCP guidance is useful if you want a parallel SEO angle on the same issue.
If your origin is already busy, don't start by shaving microseconds from CSS. Start by making the HTML itself cheaper to serve. In many sites, the biggest immediate win is removing avoidable delays between request and first meaningful bytes.
Remove render blocking before chasing pixels
After delivery, cut the things that hold the browser from painting the hero. Critical CSS should be inlined where it really matters, non-critical stylesheets should be deferred, and unnecessary JavaScript should not get a vote before the main content appears. A strong pattern looks like this:
<link rel="preload" as="image" href="/images/hero.webp" fetchpriority="high">
<link rel="preload" as="style" href="/css/app.css">
<link rel="stylesheet" href="/css/app.css" media="print" onload="this.media='all'">
That preload pattern works because it makes the browser care about the hero early, while the stylesheet trick delays non-essential blocking. Use it carefully, though. If you preload too many assets, you just move the queue somewhere else.
Use modern image formats where they actually help
WebP and AVIF are usually 30 to 70% smaller than JPEG and PNG, according to the 2026 guide in the brief. The Core Web Vitals guide from PageSpeed Matters ties that reduction directly to shorter downloads and better page speed. That's not a reason to rewrite your whole media pipeline blindly. It's a reason to convert the biggest above-the-fold images first, then check whether the smaller payload changes field LCP.
A good image rule is straightforward. If the visible hero is still a large JPEG, convert it, compress it, and preload the final version. If the page is image-light, the bigger win may be reducing blocking scripts instead. On sites with video-heavy or app-like templates, this PWA SEO guide is a sensible companion because the same delivery issues often show up in service workers, shell rendering, and route transitions.
The practical cutoff is this. Fix the server first, then the render path, then the hero asset. If you reverse that order, you can spend hours polishing an image that still arrives too late to matter.
Cutting INP by Reducing Main-Thread Cost
A page can look fine and still feel sticky the moment a user taps it. INP usually exposes the parts of the stack that are doing too much work on the main thread, not the parts that look slow in a static audit. The fix is to shorten the gap between input and the next visible response, which usually means cutting synchronous JavaScript first.
Find the long task, not the symptom
Open Chrome DevTools Performance and record a real interaction, not an idle page load. Look for long tasks that block the main thread during a click, tap, or keypress. Trace which function fired, which framework work followed it, and which third-party script joined the path. A page with decent Lighthouse numbers can still feel sluggish if one interaction handler does too much synchronous work.
Don't chase “faster JavaScript” as a slogan. Find the exact handler that blocks input, then shrink that handler.
One common mistake is stuffing too much state work into the same click path. Another is letting UI frameworks re-render far more than the interaction needs. Both show up as a single slow response from the user's point of view, even if the code looks tidy in review.
Defer scripts that don't deserve first interaction
Analytics tags, chat widgets, and ABM pixels often add interaction cost without helping the user complete the first action. Load them with async where possible, gate them behind interaction, or move them off the main thread with a tool such as Partytown if the vendor stack allows it. The rule is simple. If the script does not change the first interaction, it should not compete with the first interaction.
A useful checklist looks like this:
- Yield inside long work: Break large loops or expensive state updates so the browser can respond between chunks.
- Split the handler: Separate immediate UI feedback from heavier follow-up work.
- Delay third-party code: Load non-critical tags after consent, after interaction, or after the first meaningful paint.
- Remove dead framework paths: Cut code that runs on every interaction but only serves edge cases.
A short worked example makes this concrete. If a click handler fetches data, updates the DOM, and fires analytics synchronously, the browser has no room to respond. Move the analytics call out of the interaction path, render the optimistic UI first, and push heavier data work into a deferred callback. The user gets feedback immediately, and that is what INP rewards.
The validation step matters. Do not declare victory because one lab run looks cleaner. Re-test on a production-like page, watch field data after deployment, and confirm the interaction feels faster on a mid-range mobile device, not just on a dev laptop. Fivenines' explanation of RUM is a useful reference if you want to anchor that validation in real-user measurement.
Eliminating CLS With Layout Reservations
CLS is usually not a mystery. It's a missing reservation. The browser shifts things because something late in the page loads without space being set aside, and the fix is to reserve space before the content arrives. That mindset is much more useful than telling a team to “make things stable.”
Reserve space before the browser needs it
Set explicit width and height on every image and video element. Do the same for iframes and any embed that enters after the first paint. This gives the layout engine enough information to keep the page from jumping when the asset arrives. On templates with repeated components, it's often the cheapest win in the whole CWV backlog.
Fonts need the same discipline. If you use font-display: swap, pair it with size-adjust so the fallback and final font align more closely and avoid visible shifts when the webfont finishes loading. That's the difference between a page that looks settled and a page that keeps twitching after first paint.
Treat ads, banners, and embeds as layout objects
Late-injected cookie banners, ad slots, and social embeds are frequent CLS offenders because they appear after the user has already started reading. Reserve their footprint with fixed containers or aspect-ratio wrappers, and avoid inserting new content above what the user is already scanning. A small change in DOM structure can eliminate the shift without changing any business logic.
<div class="embed-wrap">
  <iframe src="..." title="Video embed"></iframe>
</div>
.embed-wrap {
  aspect-ratio: 16 / 9;
  width: 100%;
}
.embed-wrap iframe {
  width: 100%;
  height: 100%;
}
That pattern prevents the common mistake of letting an iframe push the rest of the page down after load. It's especially useful on CMS templates where editors can drop embeds into otherwise stable article layouts.
Layout shifts are usually self-inflicted. The browser is rarely guessing. It's reacting to missing dimensions, unstable fonts, or late content that had no reserved space.
For debugging, use DevTools' Layout Shift Regions recording and watch which elements move during a representative user flow. Don't inspect only the homepage. Check a product page, an article page, and any template that loads dynamic modules after first paint. The pattern usually shows up fast once you record an actual path through the page.
Monitoring CWV as an Ongoing Loop
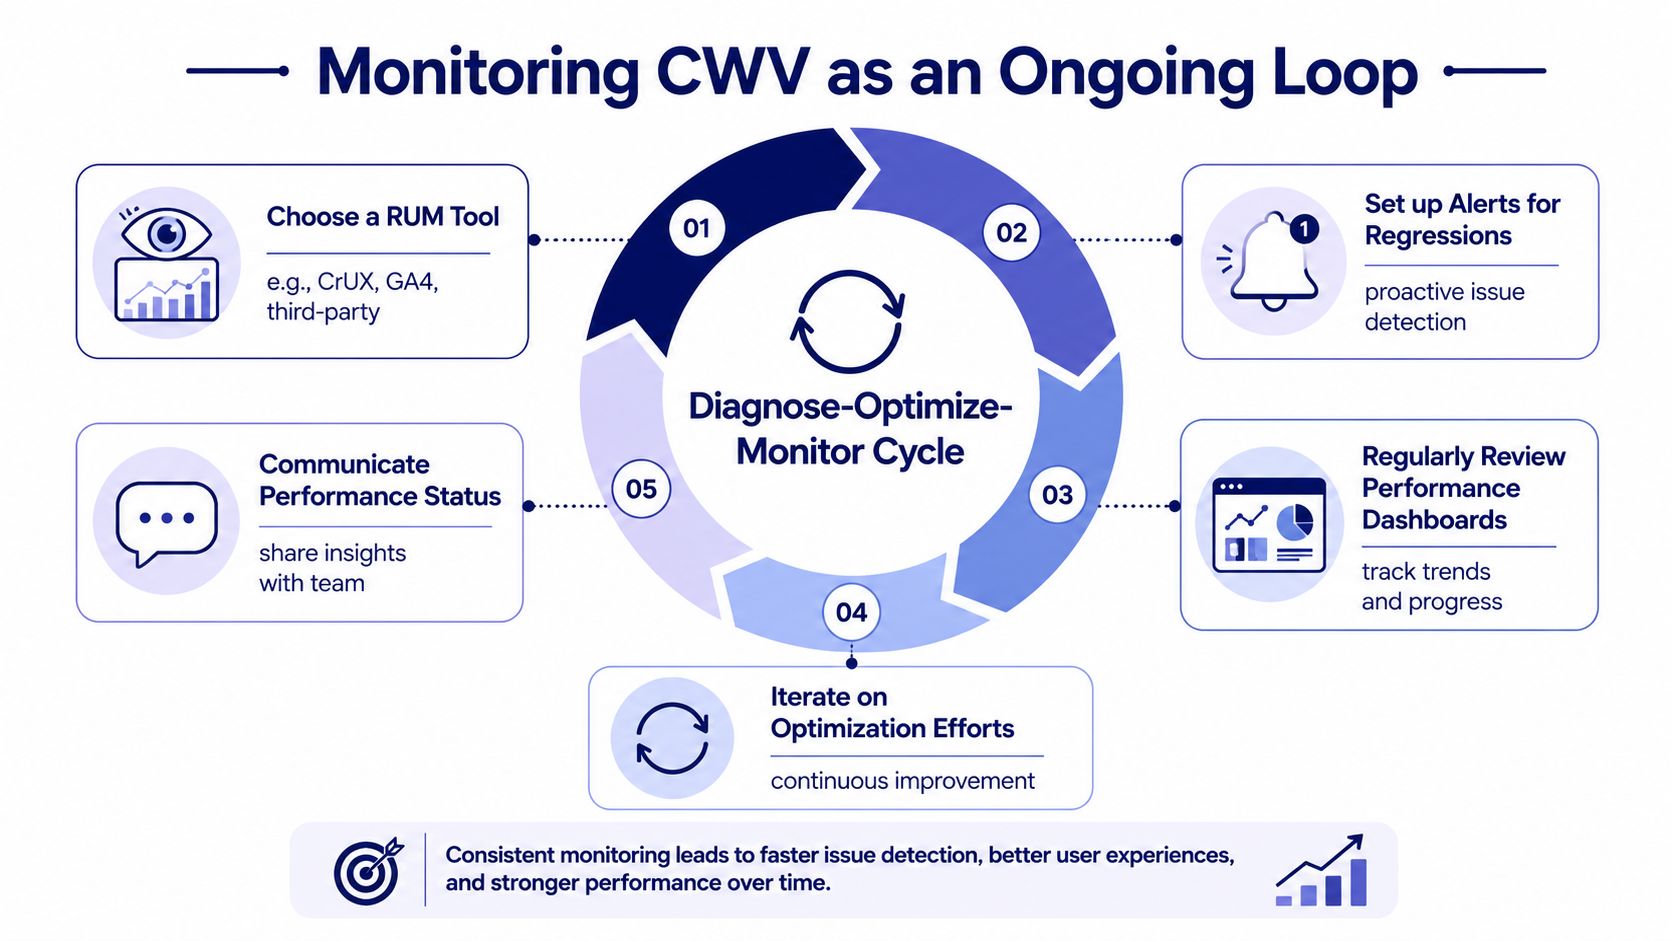
CWV work only sticks when it becomes part of routine site operations. The teams that make progress do not treat performance as a one-and-done cleanup. They diagnose, change, verify, and watch the same URLs again, because templates drift, third-party code changes, and a new module can reopen a problem that looked fixed last month. The workflow is straightforward if you keep it tied to real pages and real release cycles.
Pick one real-user source and one regression guard
Field measurement should come from one source you trust, such as Chrome User Experience Report, a RUM provider, or CrUX data in BigQuery. That tells you what visitors experience on the URLs that matter. For regression control, pair that with synthetic checks in Lighthouse CI or WebPageTest, which are better at catching template breakage before it spreads. how RUM works is a useful reference if your team still treats lab and field data as the same thing.
A reporting layer helps the work survive handoffs. Internal dashboards like Nuwtonic's SEO dashboard reporting can sit beside performance review meetings when teams need one place to see which URL groups need attention, but the source of truth should stay tied to field behavior.
Set the cadence, then stick to it
Weekly Search Console triage keeps the backlog honest. Per-deploy synthetic checks catch broken templates before they spread. A quarterly review answers the question many teams avoid, whether the CWV work is helping the pages that matter or just producing cleaner charts. That matters because a ranking signal is not the same thing as a guaranteed ranking jump.
Google's page experience guidance makes the same point from another angle. Core Web Vitals can help search performance, but they sit alongside relevance, content quality, and intent match, so the bigger return often shows up in engagement and conversion rather than a dramatic SERP jump. Google's page experience guidance is the clearest reminder not to overstate what performance alone can do.
Keep the loop visible
- Choose a RUM source: Make one production dataset the default for decisions.
- Alert on regressions: Do not wait for a monthly report to catch a broken deploy.
- Review trends weekly: Look at URL groups, not just a homepage score.
- Assign fixes to owners: Performance work slows down when it belongs to “the team.”
- Share the status: Product, SEO, and engineering need the same view.
If you want a platform to centralize that workflow, the Nuwtonic execution layer can connect Search Console issues to reviewable fixes and content updates. The tool matters less than the habit. The goal is to make CWV part of normal site operations, not a rescue mission after every release.
Mistakes to Avoid When Shipping CWV Fixes
The fastest way to waste an engineering sprint is to optimize the wrong signal. Lighthouse is useful, but it's still a lab test, and lab tests can miss mobile network constraints and third-party script behavior in real traffic. If the field data is still failing, a clean synthetic run doesn't count as a fix.
Another common mistake is shipping cosmetic CSS changes while leaving a real main-thread bottleneck untouched. A page can look more polished and still feel slow if one interaction handler hogs the browser for too long. The user doesn't care that the font is prettier if the click still waits.
Don't treat CWV as a one-off project either. Templates change, CMS editors add embeds, marketing inserts new tags, and the metric drifts back. The only sustainable pattern is ongoing measurement and small, repeated fixes.
Fix the pages that move business outcomes. Ignore the urge to polish every thin, low-traffic URL into perfection.
The cleanest decision rule is blunt. Skip pages with thin traffic, skip pages already in the green field-data band, and skip perfection chasing when competitors in the same SERP are clearly worse. Fix the gap that matters, not the number that looks nice in a report. That's how technical SEO work earns its keep.
If you want a team that connects performance issues to search impact instead of leaving them in a dashboard, Nuwtonic helps surface prioritized technical fixes and turn them into reviewable work. Visit Nuwtonic if you want a system for tracking performance issues, SEO opportunities, and the pages that deserve attention first.