
You're probably looking at one of two situations right now.
Either your SEO dashboard is full of charts that nobody acts on, or your team is still stitching together Google Search Console, GA4, rank trackers, crawl data, and backlink reports every reporting cycle. In both cases, the result is the same. The dashboard exists, the report gets sent, and the next decision still happens in Slack, a spreadsheet, or someone's head.
That's the core problem with most seo dashboard reporting. It stops at visibility. It should drive action.
The teams that get real value from reporting don't build prettier graphs. They build a reporting system that answers three questions fast: what changed, why it changed, and who owns the next move. In practice, that means stakeholder-specific views, connected data, drill-through diagnostics, AI search visibility tracking, and workflows that turn alerts into work.
Table of Contents
- Beyond Data Dumps The Goal of Actionable SEO Reporting
- Aligning KPIs with Stakeholder Needs
- Unifying Your Core SEO Data Sources
- Designing Dashboards That Tell a Story
- Automating Insights to Trigger Action
- Troubleshooting Common Reporting Failures
- Advanced SEO Reporting FAQ
Beyond Data Dumps The Goal of Actionable SEO Reporting
A passive dashboard shows that clicks dropped. An actionable dashboard tells you whether the drop came from lower impressions, weaker CTR, indexation loss, content decay, device-specific UX issues, or a SERP change that needs a different response.
That difference matters because reporting time is expensive. When teams spend hours compiling exports and screenshots, then deliver a document without ownership or next steps, the report becomes a historical artifact. It doesn't guide prioritization. It just records confusion.
What actionable reporting actually looks like
An actionable reporting system has a few critical attributes:
- It serves a specific audience: Executives need business impact. SEO managers need channel and page-level performance. Practitioners need root-cause signals.
- It links symptoms to causes: If conversions fall, the team should be able to trace that through landing pages, query shifts, rankings, crawl issues, and UX regressions.
- It assigns owners: Every important change needs a named next action, not just commentary.
- It respects reporting cadence: Daily monitoring, weekly diagnostics, and monthly narrative reporting should not live in the same visual layer.
Practical rule: If a stakeholder can't tell what to do in the next five minutes, the dashboard is still a data dump.
The biggest mindset shift is this. Don't build a dashboard to “show performance.” Build it to support a decision. That usually means each view should answer one job clearly. Should we defend a page losing CTR? Should we fix mobile friction on high-impression URLs? Should we rewrite a page that lost AI citations? Should we escalate technical debt?
The real enemy is not missing data
The primary enemy is unprioritized data.
A crowded dashboard makes every metric look equally important. They aren't. Organic traffic, page-level conversions, click decay, rank movement, technical regressions, and AI visibility losses deserve different urgency depending on who's looking. Good seo dashboard reporting turns that hierarchy into the interface itself.
When reporting works, it becomes the operating system for SEO. It stops being a presentation layer and starts functioning like an action engine.
Aligning KPIs with Stakeholder Needs
Most dashboard failures happen before anyone opens Looker Studio, Power BI, or a reporting platform. They start when a team collects metrics without deciding who needs them and what decisions those metrics should support.
A better approach starts with a measurement model. Siteimprove's guidance on dashboard measurement models is right on this point: successful SEO dashboard reporting relies on designing a measurement model, not just a visual dashboard, by correlating technical fixes with business outcomes using statistical rigor and clear ownership. The same guidance warns that overcomplicating the view into an “airplane cockpit” makes stakeholders ignore it, which is exactly what happens in bloated client decks and internal reporting hubs.
A simple way to prevent that is to map KPIs top-down.
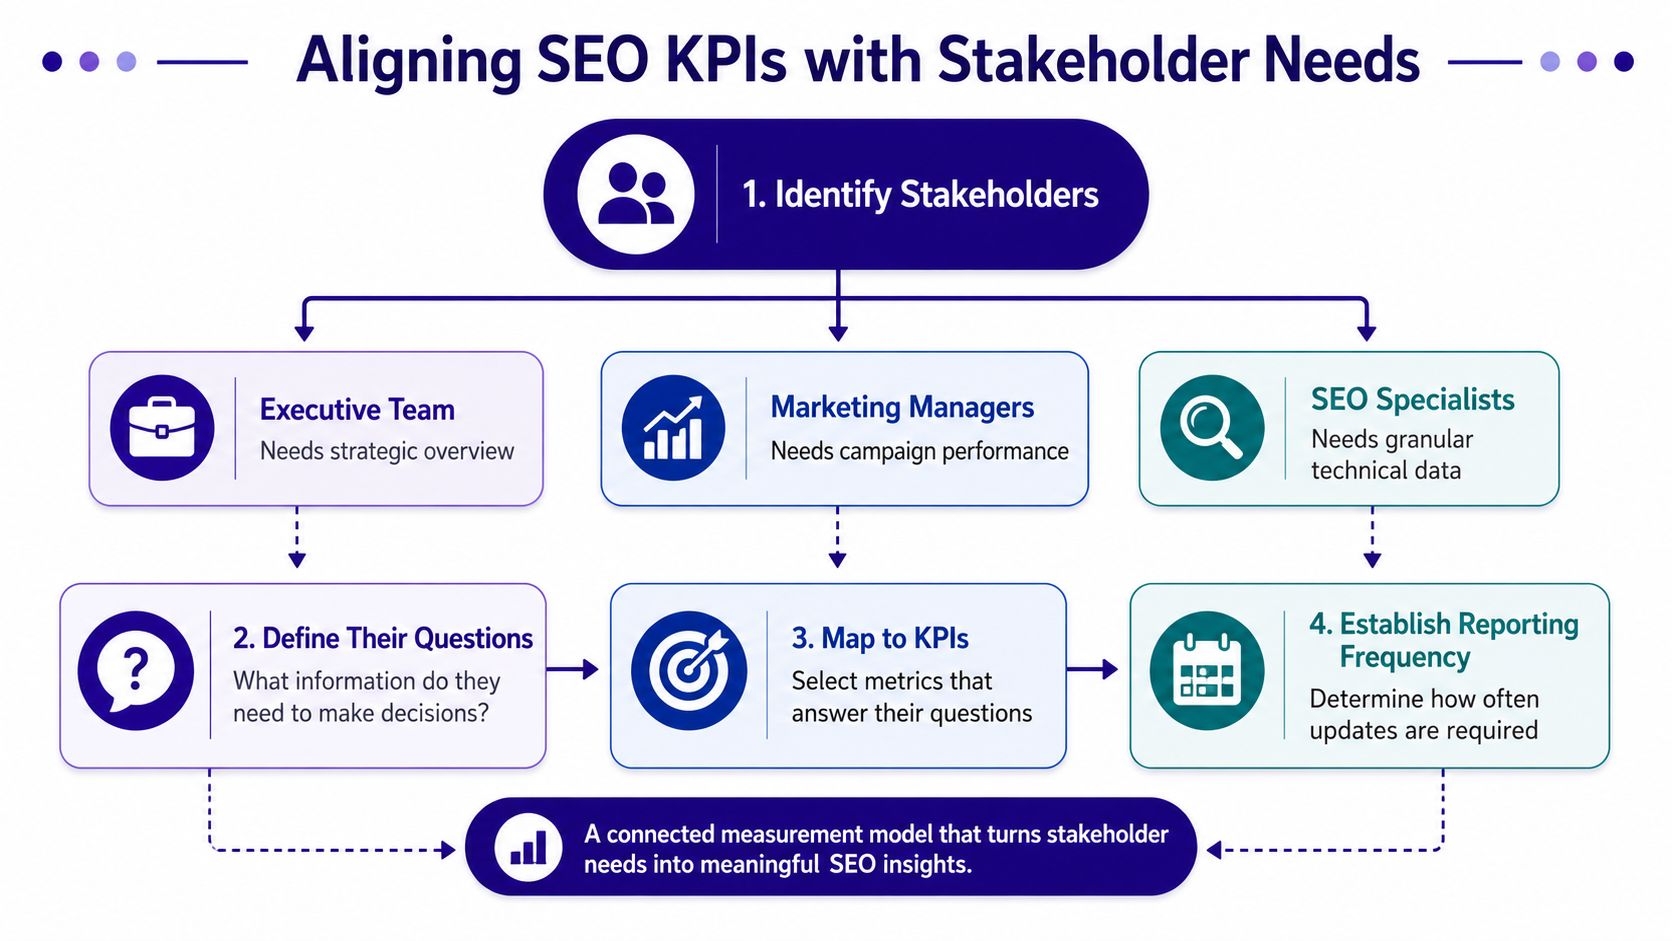
Start with decisions, not metrics
The cleanest KPI selection process looks like this:
- Name the stakeholder
- Write the decisions they make
- List the questions they ask before making those decisions
- Choose only the metrics that answer those questions
- Set the reporting cadence based on decision speed
That sounds obvious, but many organizations reverse it. They start with available metrics, then try to justify them later.
Here's the practical mapping.
| Stakeholder | Primary Questions | Key Metrics | Reporting Cadence |
|---|---|---|---|
| Executive team | Is SEO contributing to business growth, and where is risk increasing? | Organic conversions, revenue contribution, portfolio trends, major visibility shifts, risk flags | Monthly |
| Marketing director | Which segments, pages, and campaigns are driving qualified organic outcomes? | Landing page performance, conversion trends, device and geography splits, channel contribution | Weekly and monthly |
| SEO practitioner | What changed, why did it change, and what needs fixing first? | Clicks, impressions, CTR, average position, indexation signals, technical errors, rank movement, page-level diagnostics | Daily and weekly |
The executive layer should be small. If the C-suite sees a dashboard full of crawl budget details and individual keyword fluctuations, the reporting has already failed. They need movement, direction, risk, and proof.
For performance teams, the questions get sharper. Which templates are dropping CTR? Which page groups lost impressions? Which device category underperformed? Which URLs generate traffic but not conversions? For AI search work, this is also where teams need visibility into citation patterns and answer-engine presence. AI search visibility metrics and KPIs deserve their own measurement layer because they answer a different strategic question than classic rankings.
A short visual explainer helps if you're socializing this framework internally:
Build two views, not one giant dashboard
The strongest reporting setups usually split into an executive view and a squad view.
- Executive view: Portfolio health, trend direction, ROI proof, and major risks
- Squad view: Page-specific fixes, technical diagnostics, rankings, content opportunities, and owner-level next steps
That split also lines up with practical reporting advice from Digital Strike's SEO reporting methodology, which emphasizes standardized KPI definitions, separate executive and actionable views, and the danger of reports that lack a clear action plan.
A stakeholder dashboard should reduce choice. A practitioner dashboard should increase precision.
If you try to satisfy both audiences with one canvas, you usually get the worst of both. Too shallow for specialists, too noisy for leaders. Good seo dashboard reporting respects role boundaries and gives each person only the level of detail they can act on.
Unifying Your Core SEO Data Sources
A dashboard can't explain SEO performance if it only sees one layer of the system.
Search Console tells you how users found you. GA4 tells you what they did after they landed. Rank tracking shows competitive movement and target keyword direction. Backlink and third-party SEO tools add authority, technical, and gap context. Without the full picture, teams end up diagnosing the wrong problem.
That's why integrated reporting is now table stakes. Reporting Ninja's breakdown of white-label SEO dashboards states that effective SEO dashboards in 2026 connect at minimum five core data sources: Google Analytics 4, Google Search Console, third-party SEO tools, rank tracking platforms, and backlink analysis platforms. The same source notes that 92% of marketers now rely on such integrated dashboards to monitor organic traffic, keyword rankings, backlink profiles, and technical health.
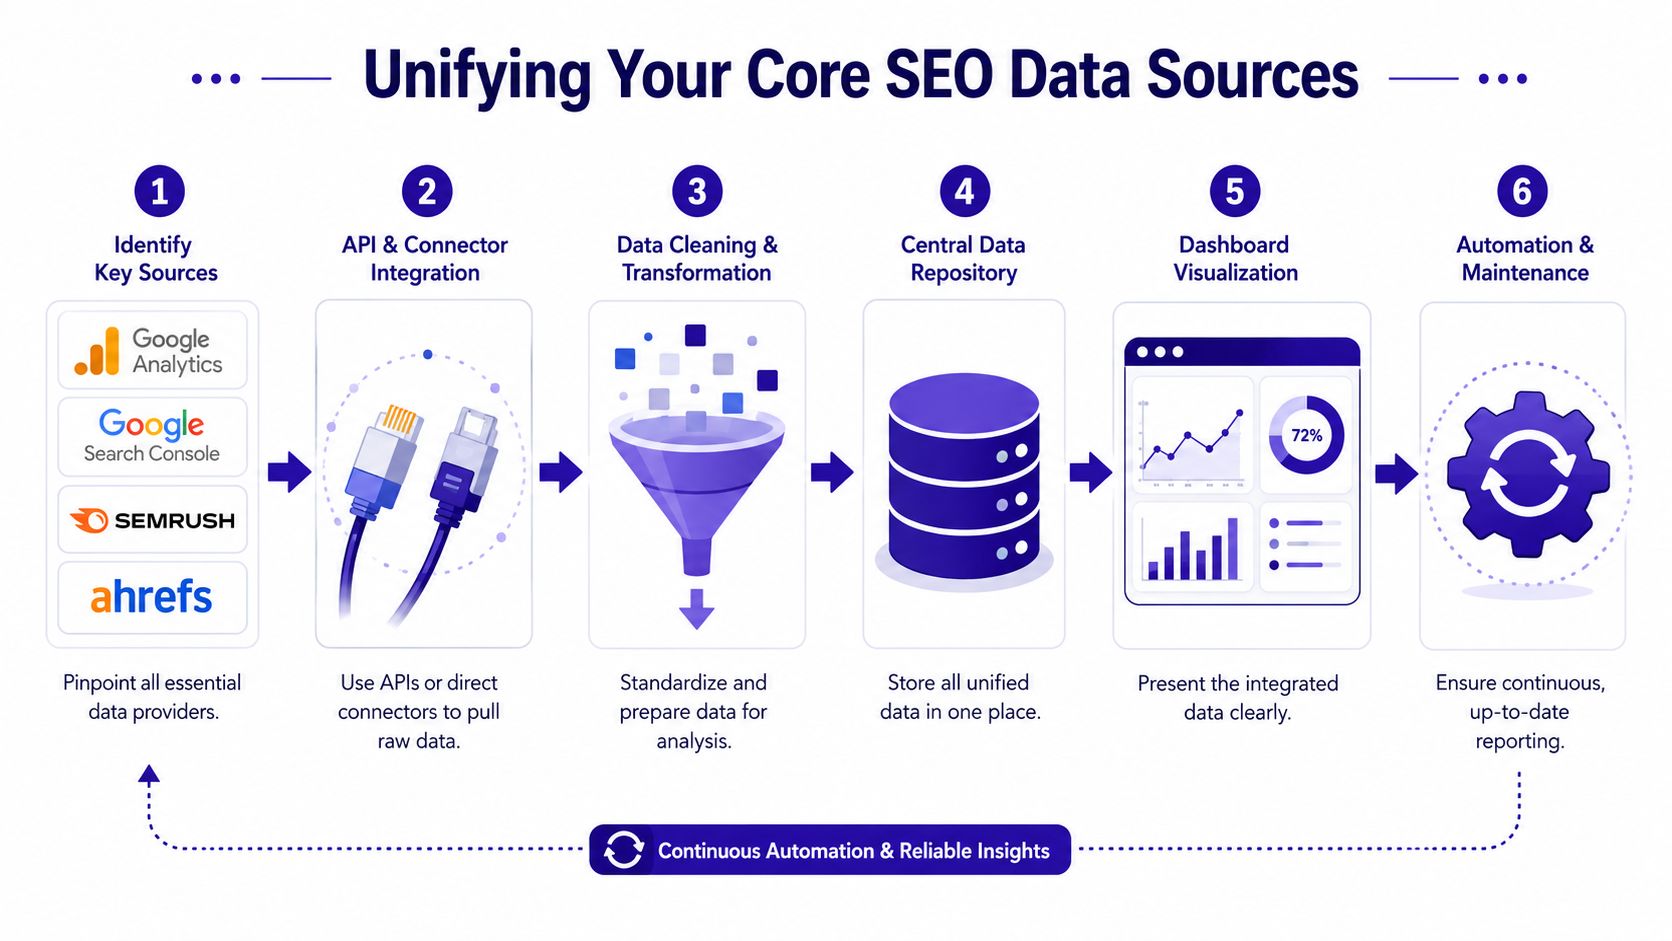
What each source contributes
Each source should earn its place.
- Google Search Console: Best for clicks, impressions, CTR, query visibility, and URL-level search performance
- GA4: Best for sessions, engagement, conversions, landing page outcomes, and downstream business behavior
- Rank tracking platform: Best for daily keyword movement, share of visibility, and monitored term volatility
- Backlink analysis tool: Best for link acquisition trends, authority shifts, and off-page risk
- Third-party technical or competitive SEO platform: Best for audits, issue tracking, SERP gap analysis, and competitor benchmarking
One source can't substitute for another. A page can gain impressions in Search Console while losing conversions in GA4. A keyword can hold in a rank tracker while real CTR drops because SERP features changed. A ranking loss can originate in technical debt that only audit tooling catches.
If your dashboard only shows one layer, the team will fill the gaps with assumptions.
That's where a central reporting layer matters. Instead of asking people to mentally reconcile multiple tools, the dashboard should place those signals next to each other. Search demand. On-site behavior. Rankings. Links. Technical health. One operating surface.
For teams that want this in a more focused visibility workflow, a GSC performance dashboard is usually the best starting point because Search Console data often exposes the earliest symptoms before revenue impact shows up elsewhere.
How to wire them into one reporting layer
The integration sequence matters more than many realize.
Start by standardizing your dimensions. URL rules, branded vs. non-branded logic, page groups, markets, devices, and conversion definitions need to match across systems. If they don't, your reporting will look precise while telling conflicting stories.
Then structure the dashboard around relationships, not tool outputs:
| Reporting Layer | Primary Source | Supporting Source | Core Question |
|---|---|---|---|
| Search visibility | GSC | Rank tracker | Are we being seen for the right queries and pages? |
| On-site outcomes | GA4 | GSC landing pages | Is organic traffic engaging and converting? |
| Competitive position | Rank tracker | third-party SEO tool | Where are we gaining or losing ground? |
| Authority and trust | Backlink platform | technical tool | Is off-page strength supporting rankings? |
| Technical risk | audit tool | GSC | Are site issues suppressing discoverability or UX? |
This is also where many dashboards become more useful than the underlying tools. A unified report can show that a page lost clicks, held position, dropped CTR, and underperformed on mobile. That tells the team where to investigate first. Separate dashboards rarely do.
The job isn't to combine everything. It's to combine the minimum set needed for accurate diagnosis.
Designing Dashboards That Tell a Story
Once your data is unified, the next job is sequencing. Good dashboards don't just show metrics. They guide the reader from symptom to explanation to response.
That's why layout matters more than decoration. Put the wrong chart first and the stakeholder chases the wrong issue. Put the right comparison beside it and the answer becomes obvious.
Modern reporting also needs fresher operational rhythm than monthly PDFs. AEO Engine's reporting guidance notes that modern SEO dashboards must integrate GSC and GA4 as primary data sources to capture clicks, impressions, CTR, and position trends, and it points to a weekly operating cadence where site audits run every Sunday night so teams start Monday with fresh data for recovery campaigns.
Here's what a modern search reporting interface can look like in practice:
Use chart types that answer specific questions
The quickest way to improve seo dashboard reporting is to stop choosing visuals by habit.
Use them by job:
- Time-series charts: Best for click, impression, conversion, and ranking trends across weeks or months
- Scatter plots: Useful when comparing CTR against average position, or engagement against conversions across landing pages
- Heatmap-style tables: Good for spotting page groups, devices, or markets with unusual drops
- Comparison tables: Strong for competitor gap analysis, branded vs. non-branded performance, and before/after change reviews
- Funnel views: Helpful when leadership needs to understand the progression from visibility to visits to conversions
A dashboard tells a stronger story when every chart answers one real business question. If a chart exists because it “looks executive,” remove it.
Build a visual sequence that narrows from symptom to cause
A reporting page should feel like an investigation path.
Start with the broad pattern. Then narrow.
Headline movement
Lead with a compact top row. Organic clicks, impressions, conversions, and one risk flag. This gives the reader immediate orientation.Trend context
Place a time-series view under it. That answers whether the issue is sudden, seasonal, compounding, or already recovering.Segment diagnosis Break the trend by landing page group, device type, geography, or branded status. At this point, the dashboard stops being descriptive and becomes useful.
Root-cause layer
Add the supporting diagnostic view: CTR by position, indexation changes, page speed warnings, content freshness, or ranking movements.Action layer
End with a shortlist. A dashboard should always resolve into recommended fixes, not just more charts.
A common example: a stakeholder sees lower organic conversions. A weak dashboard stops there. A strong one shows whether traffic fell, whether the drop was isolated to a handful of URLs, whether mobile users were hit harder, and whether CTR or landing page engagement changed first.
The chart order should mirror the questions a sharp SEO lead asks in a live review.
This is also why drill-through matters. The best setups let a team click from sitewide decline to page group, from page group to URL, and from URL to query patterns or technical signals. If a dashboard can't support that movement, the story breaks and the team goes back to tool-hopping.
The dashboard isn't just a summary. It's a decision path.
Automating Insights to Trigger Action
A dashboard that requires someone to notice every important change manually is still a passive system.
A significant upgrade in seo dashboard reporting is automation. Not automated commentary alone. Automated detection, routing, and task creation. When a ranking drop, technical regression, or AI visibility loss appears, the dashboard should trigger the next step without waiting for someone to compile evidence first.
This is more urgent now because search itself is changing. According to HubSpot's 2026 marketing statistics, nearly 24% of marketers are actively updating their SEO strategies to address generative AI in search, and over 92% plan on or are already using SEO optimization for both traditional and AI-powered search engines. That shift changes reporting. Teams now need to monitor traditional search performance alongside AI Overview citations, answer engine visibility, and page-level machine readability signals.
Alerts should create work, not just noise
Most alerts fail because they aren't tied to a playbook.
A useful alert has four parts:
- Trigger condition: A meaningful change, such as sustained rank loss, CTR decline on a high-impression page, or technical regression on a converting template
- Context payload: The URL, segment, page group, or query cluster affected
- Suggested diagnosis path: What the owner should check first
- Assigned destination: Slack, project management tool, email digest, or webhook endpoint
Without that structure, alerts become ambient anxiety.
A practical setup might look like this:
| Alert Type | What It Detects | First Owner | Immediate Action |
|---|---|---|---|
| Click decay alert | Declining clicks on historically stable URLs | SEO manager | Review query mix, CTR changes, and SERP movement |
| Technical regression alert | New sitewide or template-level issues | Technical SEO or dev lead | Validate scope and queue fix |
| Conversion disconnect alert | Organic visits holding while conversion signals weaken | CRO or SEO lead | Check page UX, offer relevance, and device split |
| Competitor movement alert | Target terms or pages losing ground | SEO strategist | Audit competitor page changes and update content plan |
For execution teams, SEO automation platforms become useful. The value isn't “AI summary text.” It's turning a signal into a reviewable workflow with owners, permissions, and deployment control.
AI search visibility now belongs in the workflow layer
Traditional SEO dashboards usually stop at rankings and traffic. That's no longer enough.
If your brand is being surfaced, omitted, or displaced in AI-generated answers, you need a reporting layer that watches those patterns the same way rank trackers watch classic SERPs. Beyond that, those changes should trigger tasks. If a high-value page loses visibility in answer engines, the team should investigate structure, entity clarity, citation support, and content completeness.
That makes AI search reporting different from standard keyword reporting in one important way. It isn't just about observation. It's about remediation.
Teams don't need another place to “see” a problem. They need a system that starts the fix.
The best action engines treat AI search changes like any other operational event. Detect the drop. Identify the affected URLs and prompts. Route the issue to the right owner. Suggest the remediation path. Track whether the update improved visibility later.
That's what modern reporting should do. It should shorten the time between signal and action.
Troubleshooting Common Reporting Failures
A reporting cycle breaks down in a familiar way. The dashboard goes out on Monday. Leadership asks why traffic is down. The SEO team opens three tools, finds mismatched numbers, and spends half the meeting explaining methodology instead of deciding what to do.
That failure usually starts long before the meeting. It starts when reporting is treated as a record of activity instead of a system for making decisions.
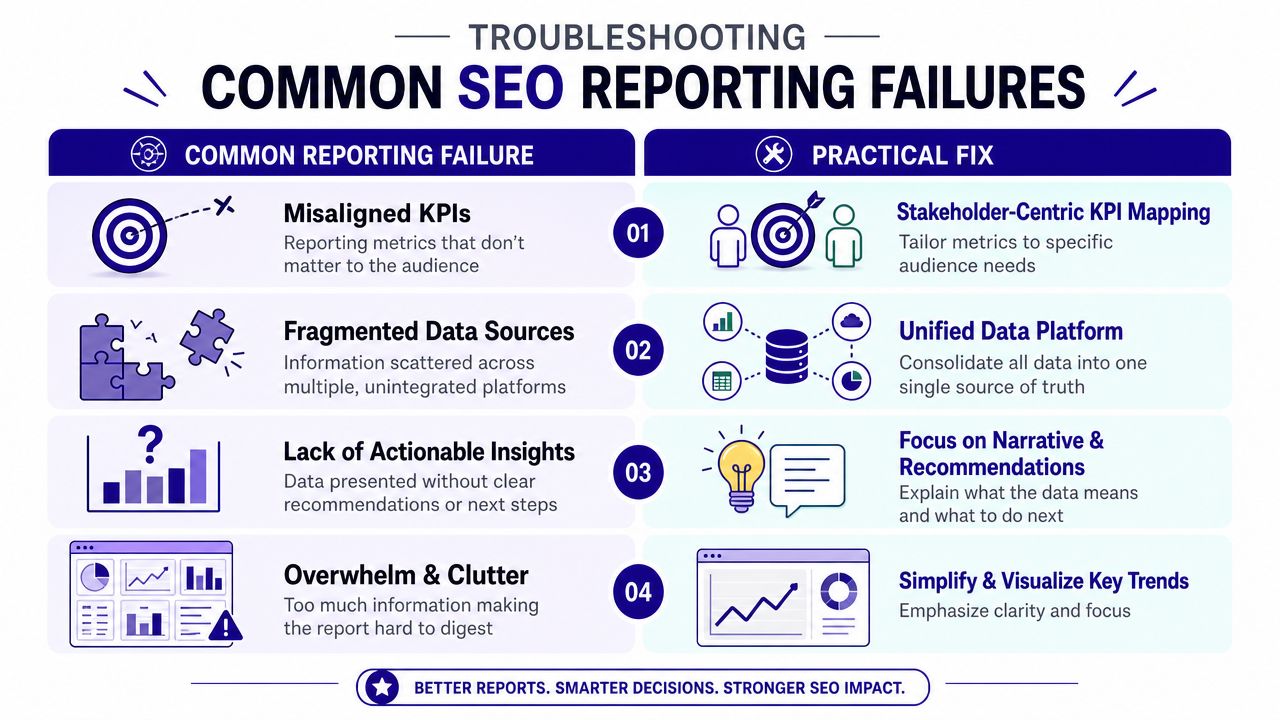
Failure patterns that waste reporting time
The same problems show up across agencies, in-house teams, and enterprise programs.
Misaligned KPIs
The audience gets metrics they cannot use. Executives see technical detail with no business context. Practitioners get top-line summaries with no diagnostic value.Fragmented source logic
Search Console, GA4, and rank tracking platforms are all pulling from different page sets, date ranges, attribution rules, or conversion definitions. The team argues about numbers before it can address performance.No narrative
Movement gets reported, but nobody explains what changed, why it changed, whether it matters, or which response comes next.Dashboard clutter
Every chart survives because someone once asked for it. The result looks busy, but it does not help a stakeholder make a decision.
A dashboard can be accurate and still fail its job.
I see another pattern often. Teams keep legacy metrics alive because a client expects to see them, even when those metrics no longer shape any action. That creates reporting debt. Every extra vanity chart steals attention from the handful of signals that should trigger investigation, prioritization, or escalation.
The smarter alternative for each failure
The fix is rarely visual. It is usually operational.
| Common Failure | Practical Fix |
|---|---|
| Misaligned KPIs | Build stakeholder-specific views based on decisions each audience needs to make |
| Fragmented data | Standardize definitions, date ranges, attribution rules, and page groupings before anything reaches the dashboard |
| No action plan | Add a required block for interpretation, owner, deadline, and next step |
| Cluttered dashboard | Remove any metric that does not support a clear decision or workflow |
The teams that improve reporting fastest usually adopt a few hard rules.
- Write a short narrative every cycle: State what changed, what likely caused it, what matters now, and who owns the response
- Keep comparison logic consistent: If you compare a different period, label it clearly and explain what that does to interpretation
- Limit each view to one job: A dashboard for executive review should not also try to be a page-level QA workspace
- Remove unowned metrics: If no one is accountable for acting on a metric, move it out of the primary view
- Attach triggers to important changes: Large drops in conversions, visibility, or AI answer presence should create tasks, not just color changes on a chart
That last point is where many SEO dashboards still fall short. They stop at display. Strong reporting systems route the issue to the right person, include the affected URLs or query groups, and make follow-up measurable. Tools like Nuwtonic help here by turning noisy reporting inputs into structured workflows instead of another layer of passive charts.
Frequency causes problems too. A dashboard that updates every few hours sounds useful, but it creates churn if there is no response protocol behind it. Monthly reporting can also fail if it arrives too late to catch revenue-impacting losses. Good reporting cadence matches decision speed, team capacity, and the cost of delay.
The strongest reports feel narrower, clearer, and easier to act on. That is the standard to aim for.
Advanced SEO Reporting FAQ
Advanced reporting questions usually show up after the basics are working. That's where it becomes clear that the dashboard itself isn't the final product. The operating model around it is.
Frequently Asked Questions on Advanced SEO Reporting
| Question | Answer |
|---|---|
| What's the difference between a tactical SEO report and a strategic dashboard? | A tactical report helps the team decide what to fix next. A strategic dashboard helps leadership understand direction, risk, and contribution. They shouldn't be the same artifact. |
| How often should SEO dashboards update? | Update based on decision speed. Operational monitoring needs frequent refreshes. Executive reporting needs stable periodic summaries with context. |
| Should every stakeholder see the same KPIs? | No. Shared KPI definitions matter, but the visible metrics should differ by audience. Executives need outcomes and risk. Practitioners need diagnostics and ownership. |
| How do you report on AI search visibility without turning it into a vanity metric? | Tie visibility changes to specific URLs, prompts, citation presence, and follow-up actions. If the metric can't trigger a diagnosis or content update, it doesn't belong on the main dashboard. |
| What should be in the monthly narrative? | Include what changed, why it changed, what the impact appears to be, what the team did, and what happens next. Keep it direct. |
| When should SEO teams use drill-through dashboards? | Use them when top-line movement needs fast root-cause analysis. If a conversion drop can't be traced back to page, query, device, or technical issue, the dashboard is too shallow. |
| Is one dashboard enough for agencies? | Usually not. Agencies often need an internal diagnostic view and a client-facing reporting view. Clients need clarity. Delivery teams need detail. |
| What's the biggest sign a reporting setup needs redesign? | Stakeholders stop using it, or the team still has to explain every chart live for the report to make sense. Good reporting should reduce explanation, not require more of it. |
The strongest seo dashboard reporting setups keep evolving because search keeps changing. Traditional rankings still matter. So do page-level conversions, technical signals, and competitive movement. But now AI-generated search surfaces also shape discoverability. The reporting stack has to reflect that reality without becoming bloated.
Nuwtonic helps teams turn reporting into execution. It combines GSC-driven insights, technical audits, content operations, and AI search visibility tracking in one workspace, then routes approved fixes through reviewable workflows instead of stopping at charts. If you want seo dashboard reporting that triggers action, explore Nuwtonic.


