
If you're trying to explain why one competitor seems to own the conversation while your own channel reports look healthy, you're not alone. The usual mess starts when SEO, PR, social, and now AI search all get reported in separate tabs, each with its own metric, its own denominator, and its own version of “visibility.” That's where share of voice earns its keep, because it turns scattered activity into one normalized view of how much of the market you capture.
Table of Contents
- What Share of Voice Actually Measures
- Calculating Organic Search Share of Voice
- Measuring Mention-Based Share of Voice for Social and PR
- AI Search Visibility and Share of Voice
- Manual Calculations Versus Automated SOV Platforms
- Common Mistakes That Invalidate Your SOV Numbers
- Building a Sustainable SOV Reporting Cadence
What Share of Voice Actually Measures
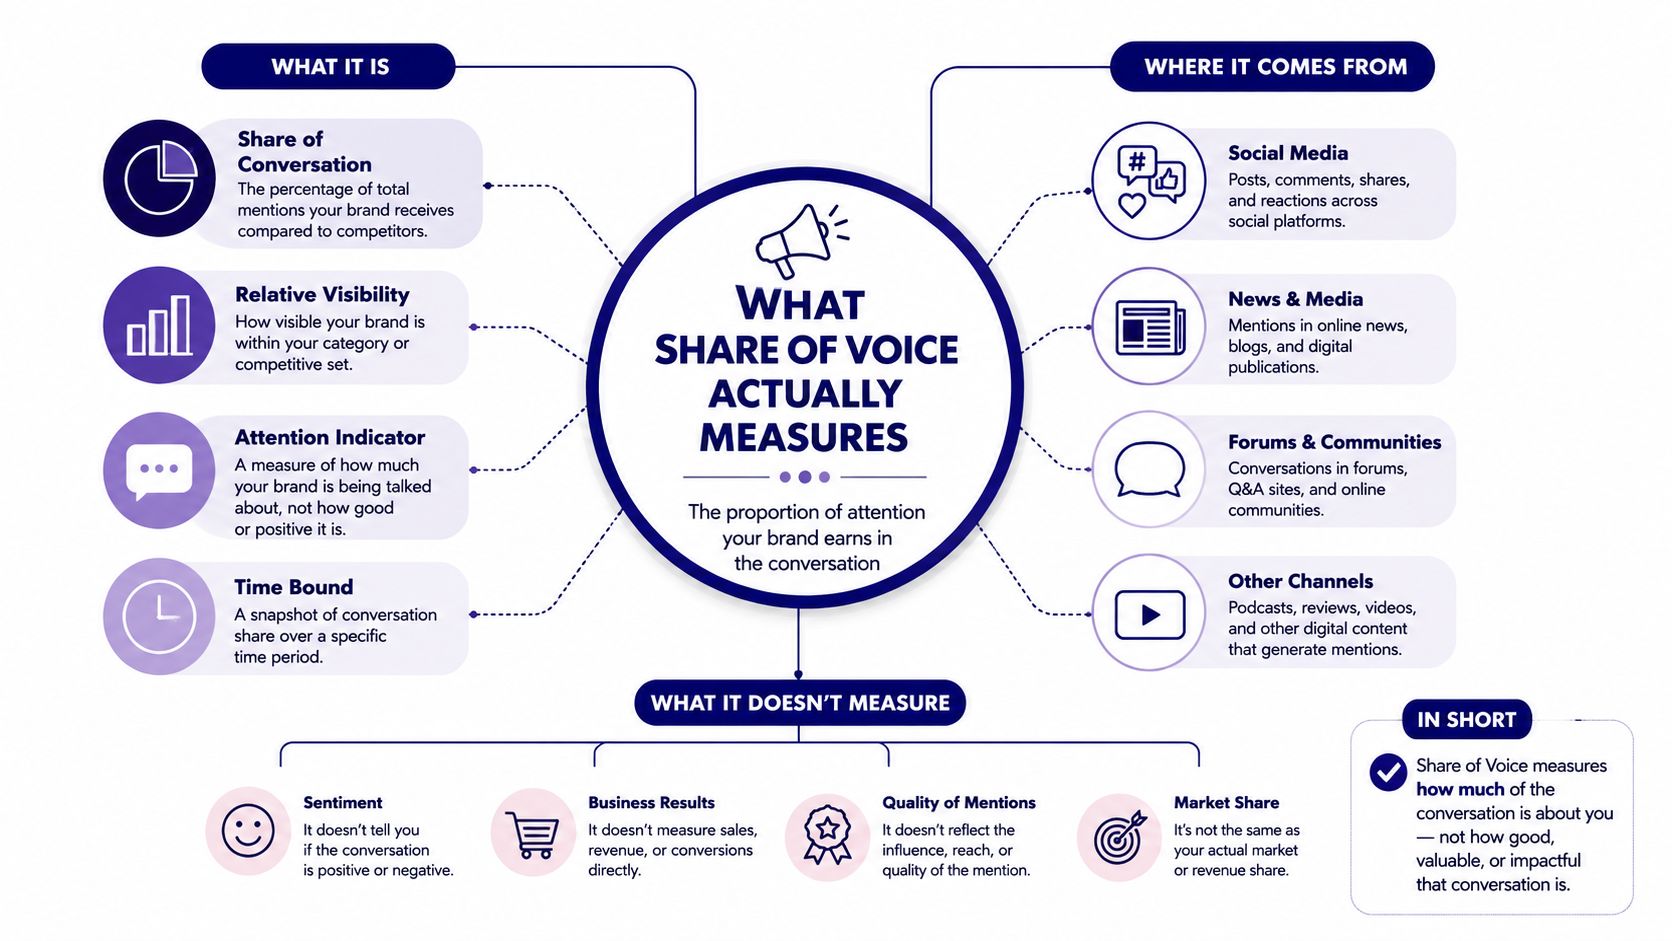
A leadership team usually doesn't want another dashboard. It wants a straight answer to a simple question, who is showing up most often in the category, and where are we losing ground. That's why share of voice matters. It normalizes visibility so a bigger brand and a smaller challenger can be compared on the same scale, instead of hiding behind raw counts that mean different things in different channels. The standard formula is brand metric divided by total market metric, multiplied by 100. In other words, SOV = Your brand metrics / Total market metrics × 100. Sprout Social's formula guide and the Cision example in the same reference show the arithmetic in plain terms, where 50 mentions out of 100 total mentions equals 50% SOV.
Define the market before you touch the formula
The denominator is the whole game. If you define the market too broadly, your percentage gets diluted. If you define it too narrowly, the number looks flattering but stops being useful for planning.
Practical rule: lock the market first, then calculate the percentage. The market can be a keyword set, a competitor group, a channel, or a campaign window, but it needs to stay consistent inside that report.
That consistency is why the metric works across channels. In SEO, the “brand metric” might be clicks or impressions. In social or PR, it might be mentions. In AI search, it can be appearances inside generated answers. The same logic applies because the purpose is still normalization, not a vanity count.
You can also see why SOV is different from simple rank tracking. Rank position alone doesn't tell you how much of category demand you capture. A low-volume keyword at position one can matter far less than a higher-volume query where you sit lower on the page. The point of SOV is to translate visibility into a share of the total, not to celebrate isolated wins.
For teams building a competitive reporting stack, this sits naturally beside broader intelligence work, like the approach described in the SEO competitive intelligence guide. The value is the same, compare against the market, not against your own internal assumptions.
Calculating Organic Search Share of Voice
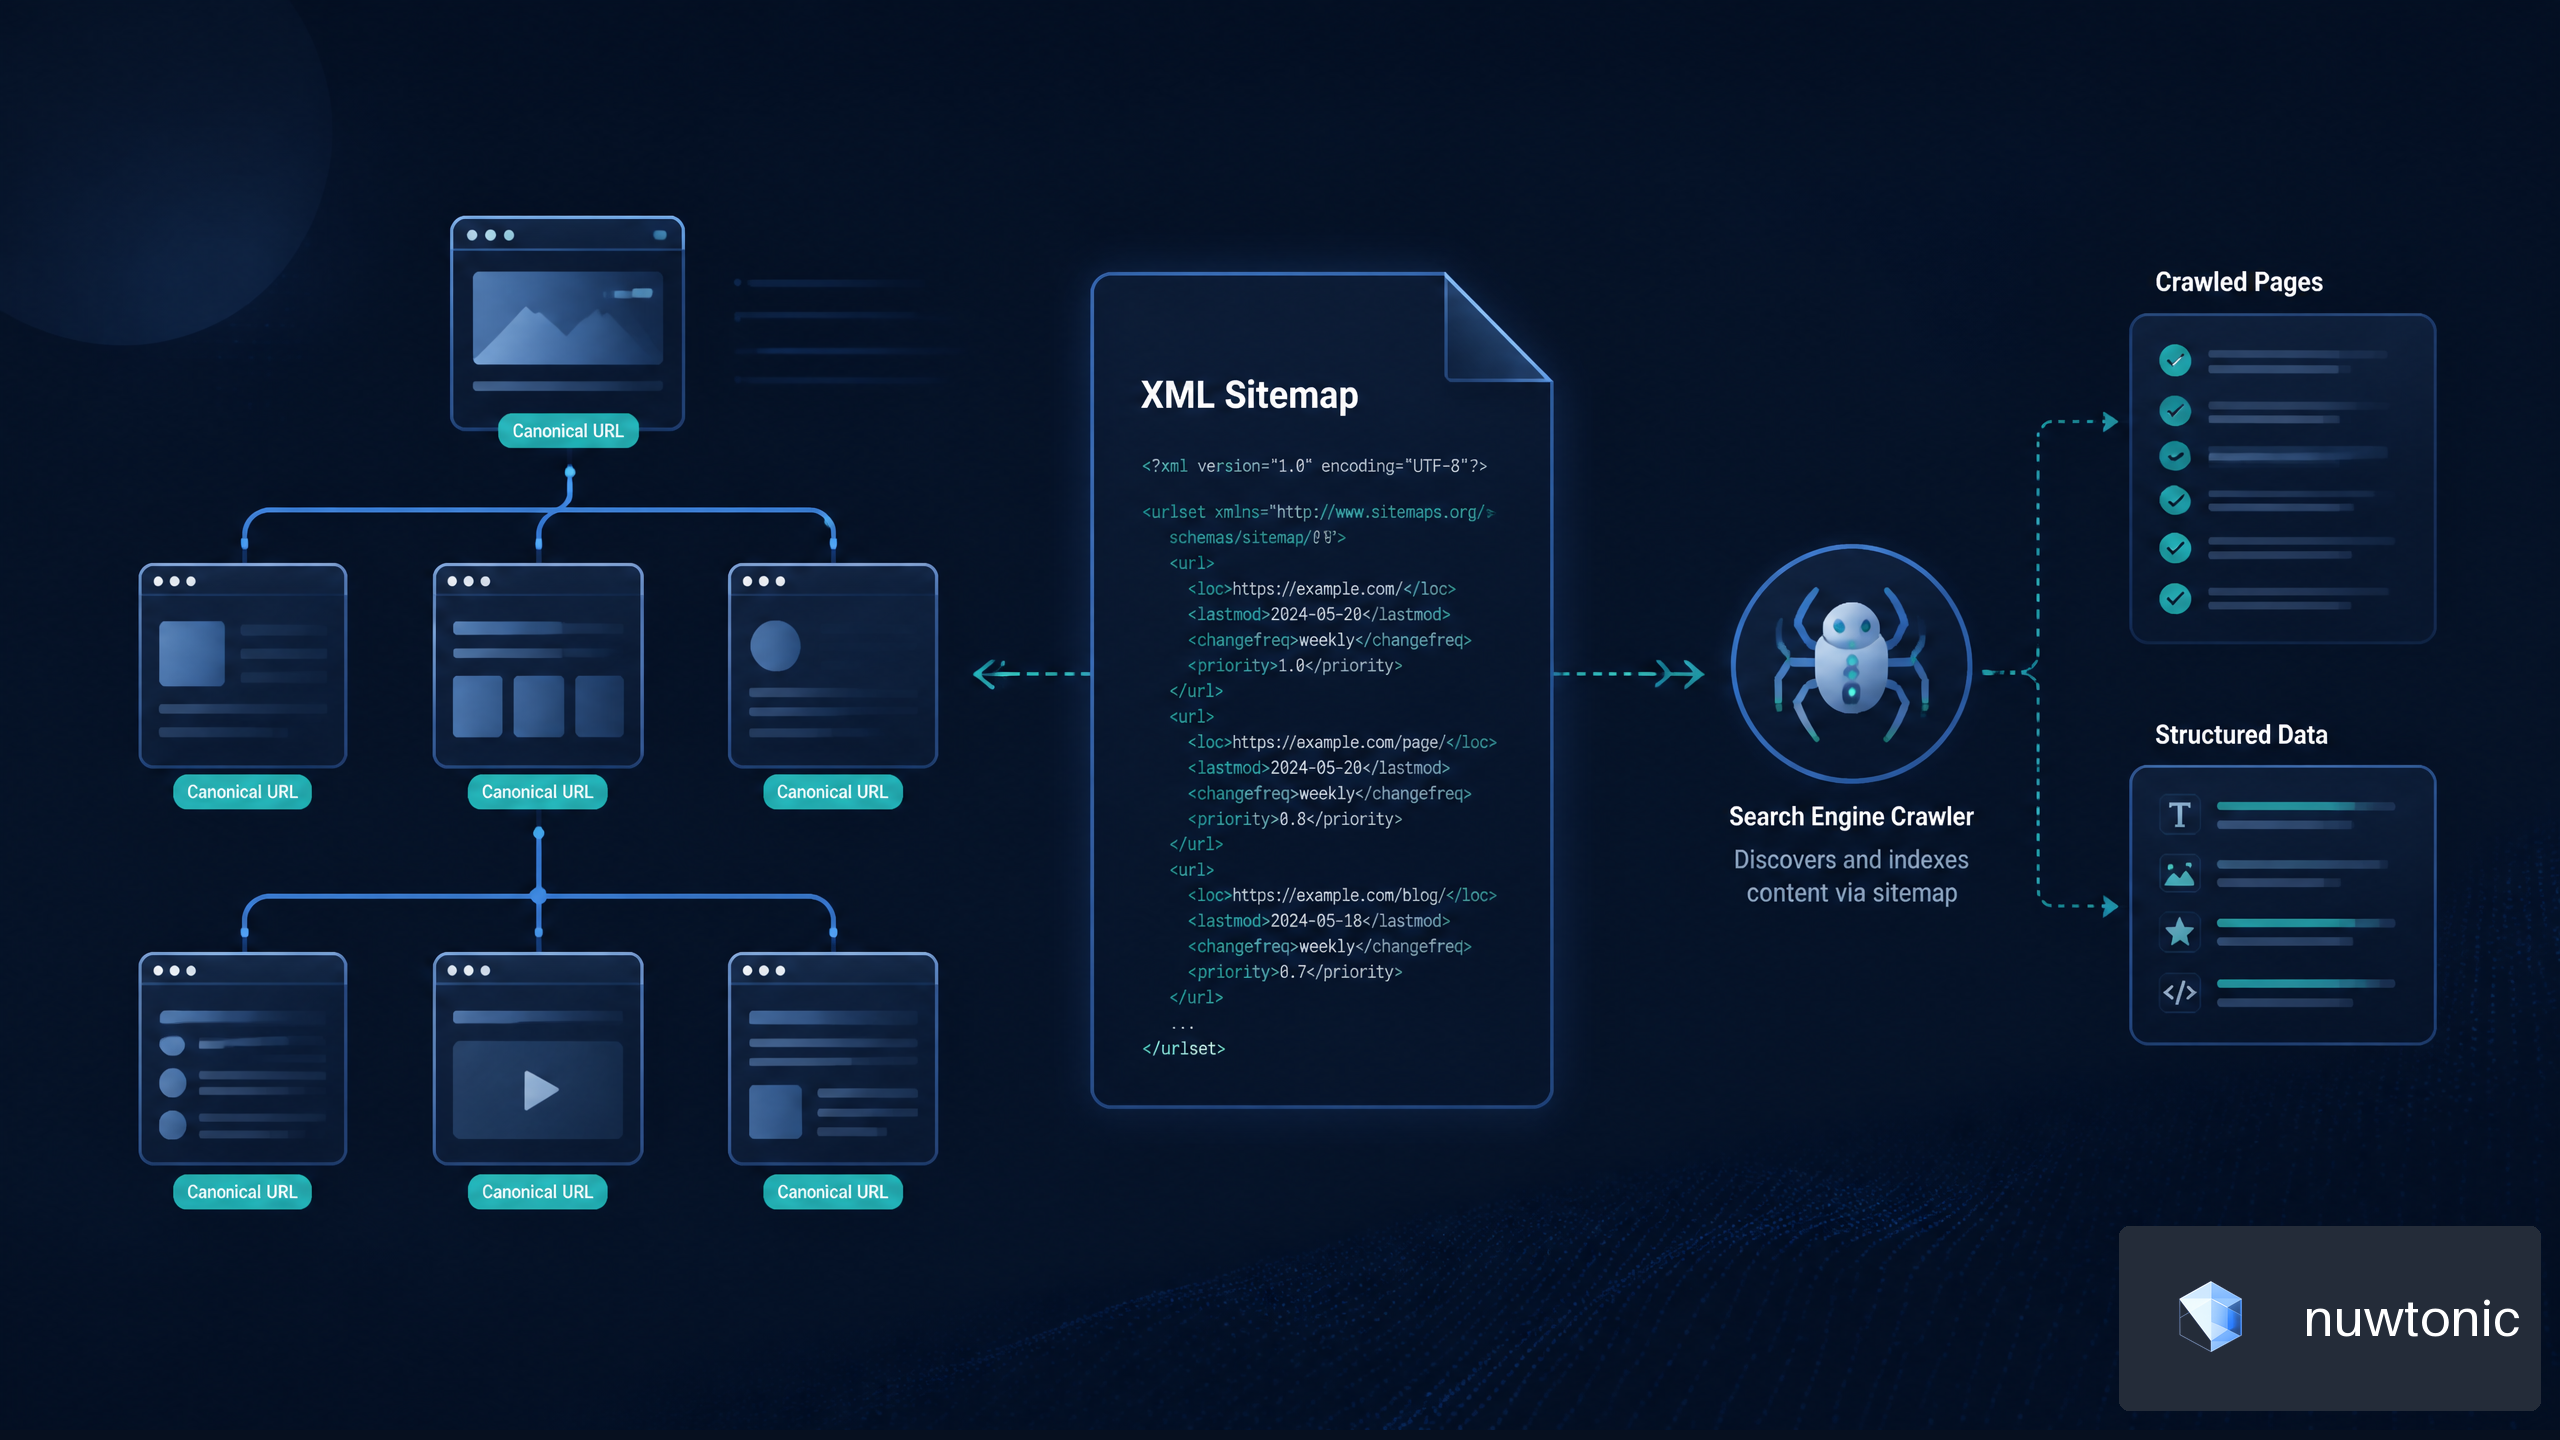
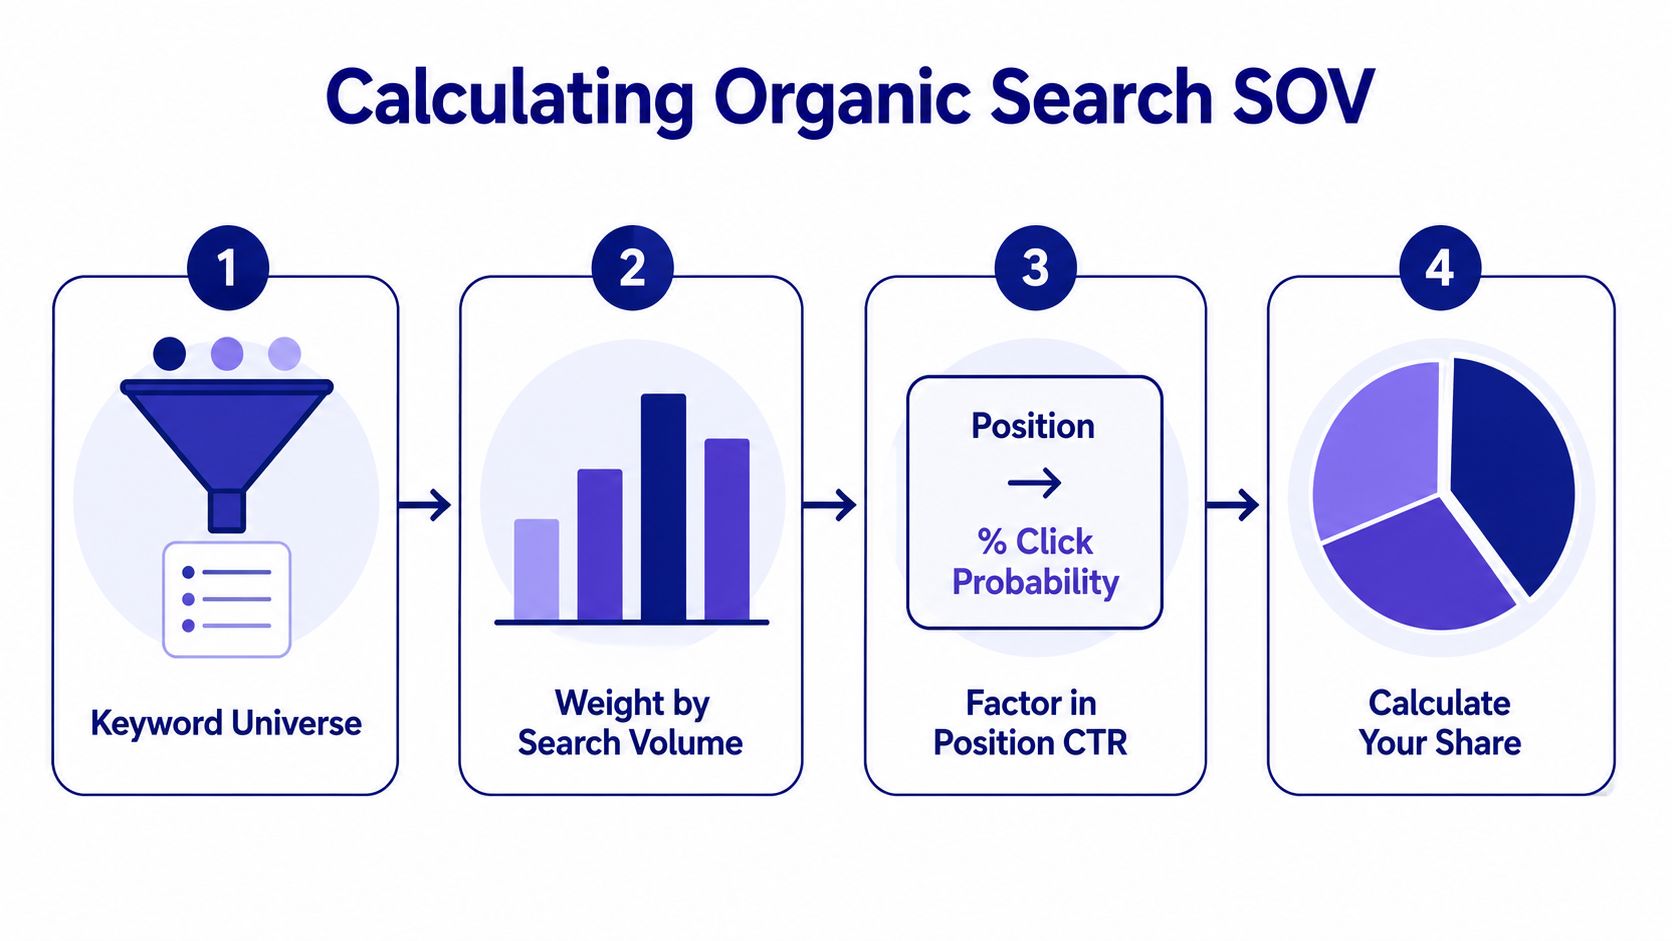
Organic search SOV fails fast when teams treat rank as the metric. Rank is only an input. The usable output is estimated traffic share across a fixed keyword universe, weighted by how much search demand each term carries. That's why the practical workflow is to define the keyword set first, then estimate clicks with a position-based CTR curve, multiply those CTRs by monthly search volume, and compare your estimated clicks against the total possible traffic for that set. Search Engine Land describes SOV for organic search as estimated traffic divided by total possible traffic, which is the version that holds up in reporting because it avoids raw-position shortcuts. Search Engine Land's SOV guide
Build the keyword universe first
Start with a fixed set of keywords that reflect the category you want to measure. That set should be stable enough to compare week to week or month to month, but specific enough to reflect real commercial demand. If the set keeps changing, the denominator moves and the percentage loses meaning.
The most common mistake here is mixing branded and non-branded terms without saying so. I prefer separate views for each, then one blended view only when the reporting question needs it. Branded queries tell you how much demand your name already owns. Non-branded queries tell you how much category demand you're winning from the market.
Weight rankings by click potential
The position curve matters because clicks are not evenly distributed. One industry guide notes that position 1 can capture roughly 30% CTR, position 2 about 15%, and position 3 about 10%, with sharp declines after that. Rankmetry's methodology overview is useful here because it frames SOV as a function of demand-weighted visibility, not just rank count.
That distinction changes the outcome immediately. A site ranking first on a set of low-volume keywords can still trail a competitor ranking third on higher-volume terms. In practice, the calculation is simple enough to run in a spreadsheet, but the inputs need discipline. Pull keyword volume from your search source of record, map current rankings from your tracker, apply the CTR curve, then sum the estimated clicks across the full list.
A clean setup usually looks like this:
- Keyword list: fixed before the measurement window opens.
- Ranking source: one tracker, one methodology, one set of competitors.
- CTR curve: one curve applied consistently across the whole file.
- Traffic estimate: clicks estimated per keyword, then aggregated.
Search visibility is a weighted share problem, not a ranking contest.
That's the practical difference between a number that looks advanced and one that predicts competitive movement. If your data is already in Google Search Console and a rank tracker, the job is mostly about enforcing consistency. If you're looking for a broader view of content actions tied to ranking movement, Nuwtonic's platform sits in that same operational lane, but the key point remains the same, your traffic share should be based on demand-weighted visibility, not raw positions.
Measuring Mention-Based Share of Voice for Social and PR
Mention-based SOV looks easy until the reporting window shifts, the competitor list changes, or one channel starts bleeding into another. The formula still stays simple, brand metric divided by total market metric, times 100, but the operational discipline is what keeps the number honest. My rule is to define the competitor set, pick one metric per channel, lock the time window, and only then count mentions across that exact scope. A useful resource for teams checking attribution and monitoring mechanics is the guide to Survey Voices for affiliates, especially if your reporting stack relies on third-party conversation data.
Keep the denominator clean
A social SOV calculation should not mix paid reach, organic mentions, and PR pickup unless you've deliberately created a blended framework. Each of those inputs has different mechanics, different noise levels, and different reporting sources. If you combine them casually, the denominator stops meaning anything.
The better practice is channel separation first, then a combined rollup only at the leadership layer. For example, PR SOV might count media mentions in a set of outlets, while social SOV might count brand mentions across selected platforms. The point is not to force one universal input. The point is to preserve comparability inside each channel.
Weight visibility when the placement quality differs
Not every mention carries the same weight. A mention in a high-authority publication can matter more than a string of low-value posts. Brandwatch and Prowly both note that weighting can be applied when calculating visibility or media coverage, which is the right move when outlet quality matters more than raw quantity. I'd use that selectively, though, because weighting adds judgment and makes the methodology harder to defend if you can't explain it clearly.
| Channel | Primary Data Source | Key Metric | Update Cadence |
|---|---|---|---|
| Organic search | Rank tracking and search demand data | Estimated clicks | Weekly or monthly |
| Social | Social listening platform | Brand mentions | Weekly |
| PR | Media monitoring tool | Media mentions | Weekly or monthly |
| AI search | Prompt tracking and response sampling | Brand appearances | Weekly |
For social and PR, sentiment is better treated as a filter or context layer, not the primary SOV input. A brand can have a high mention share and a bad reputation at the same time. Those are related, but they're not the same metric, and forcing them together muddies both.
The cleanest report I've built for this kind of work has three lanes. One lane tracks raw mention share. One lane tracks weighted visibility where outlet value matters. One lane tracks sentiment or issue themes separately, so leadership can see whether the conversation is big, positive, or just noisy.
AI Search Visibility and Share of Voice
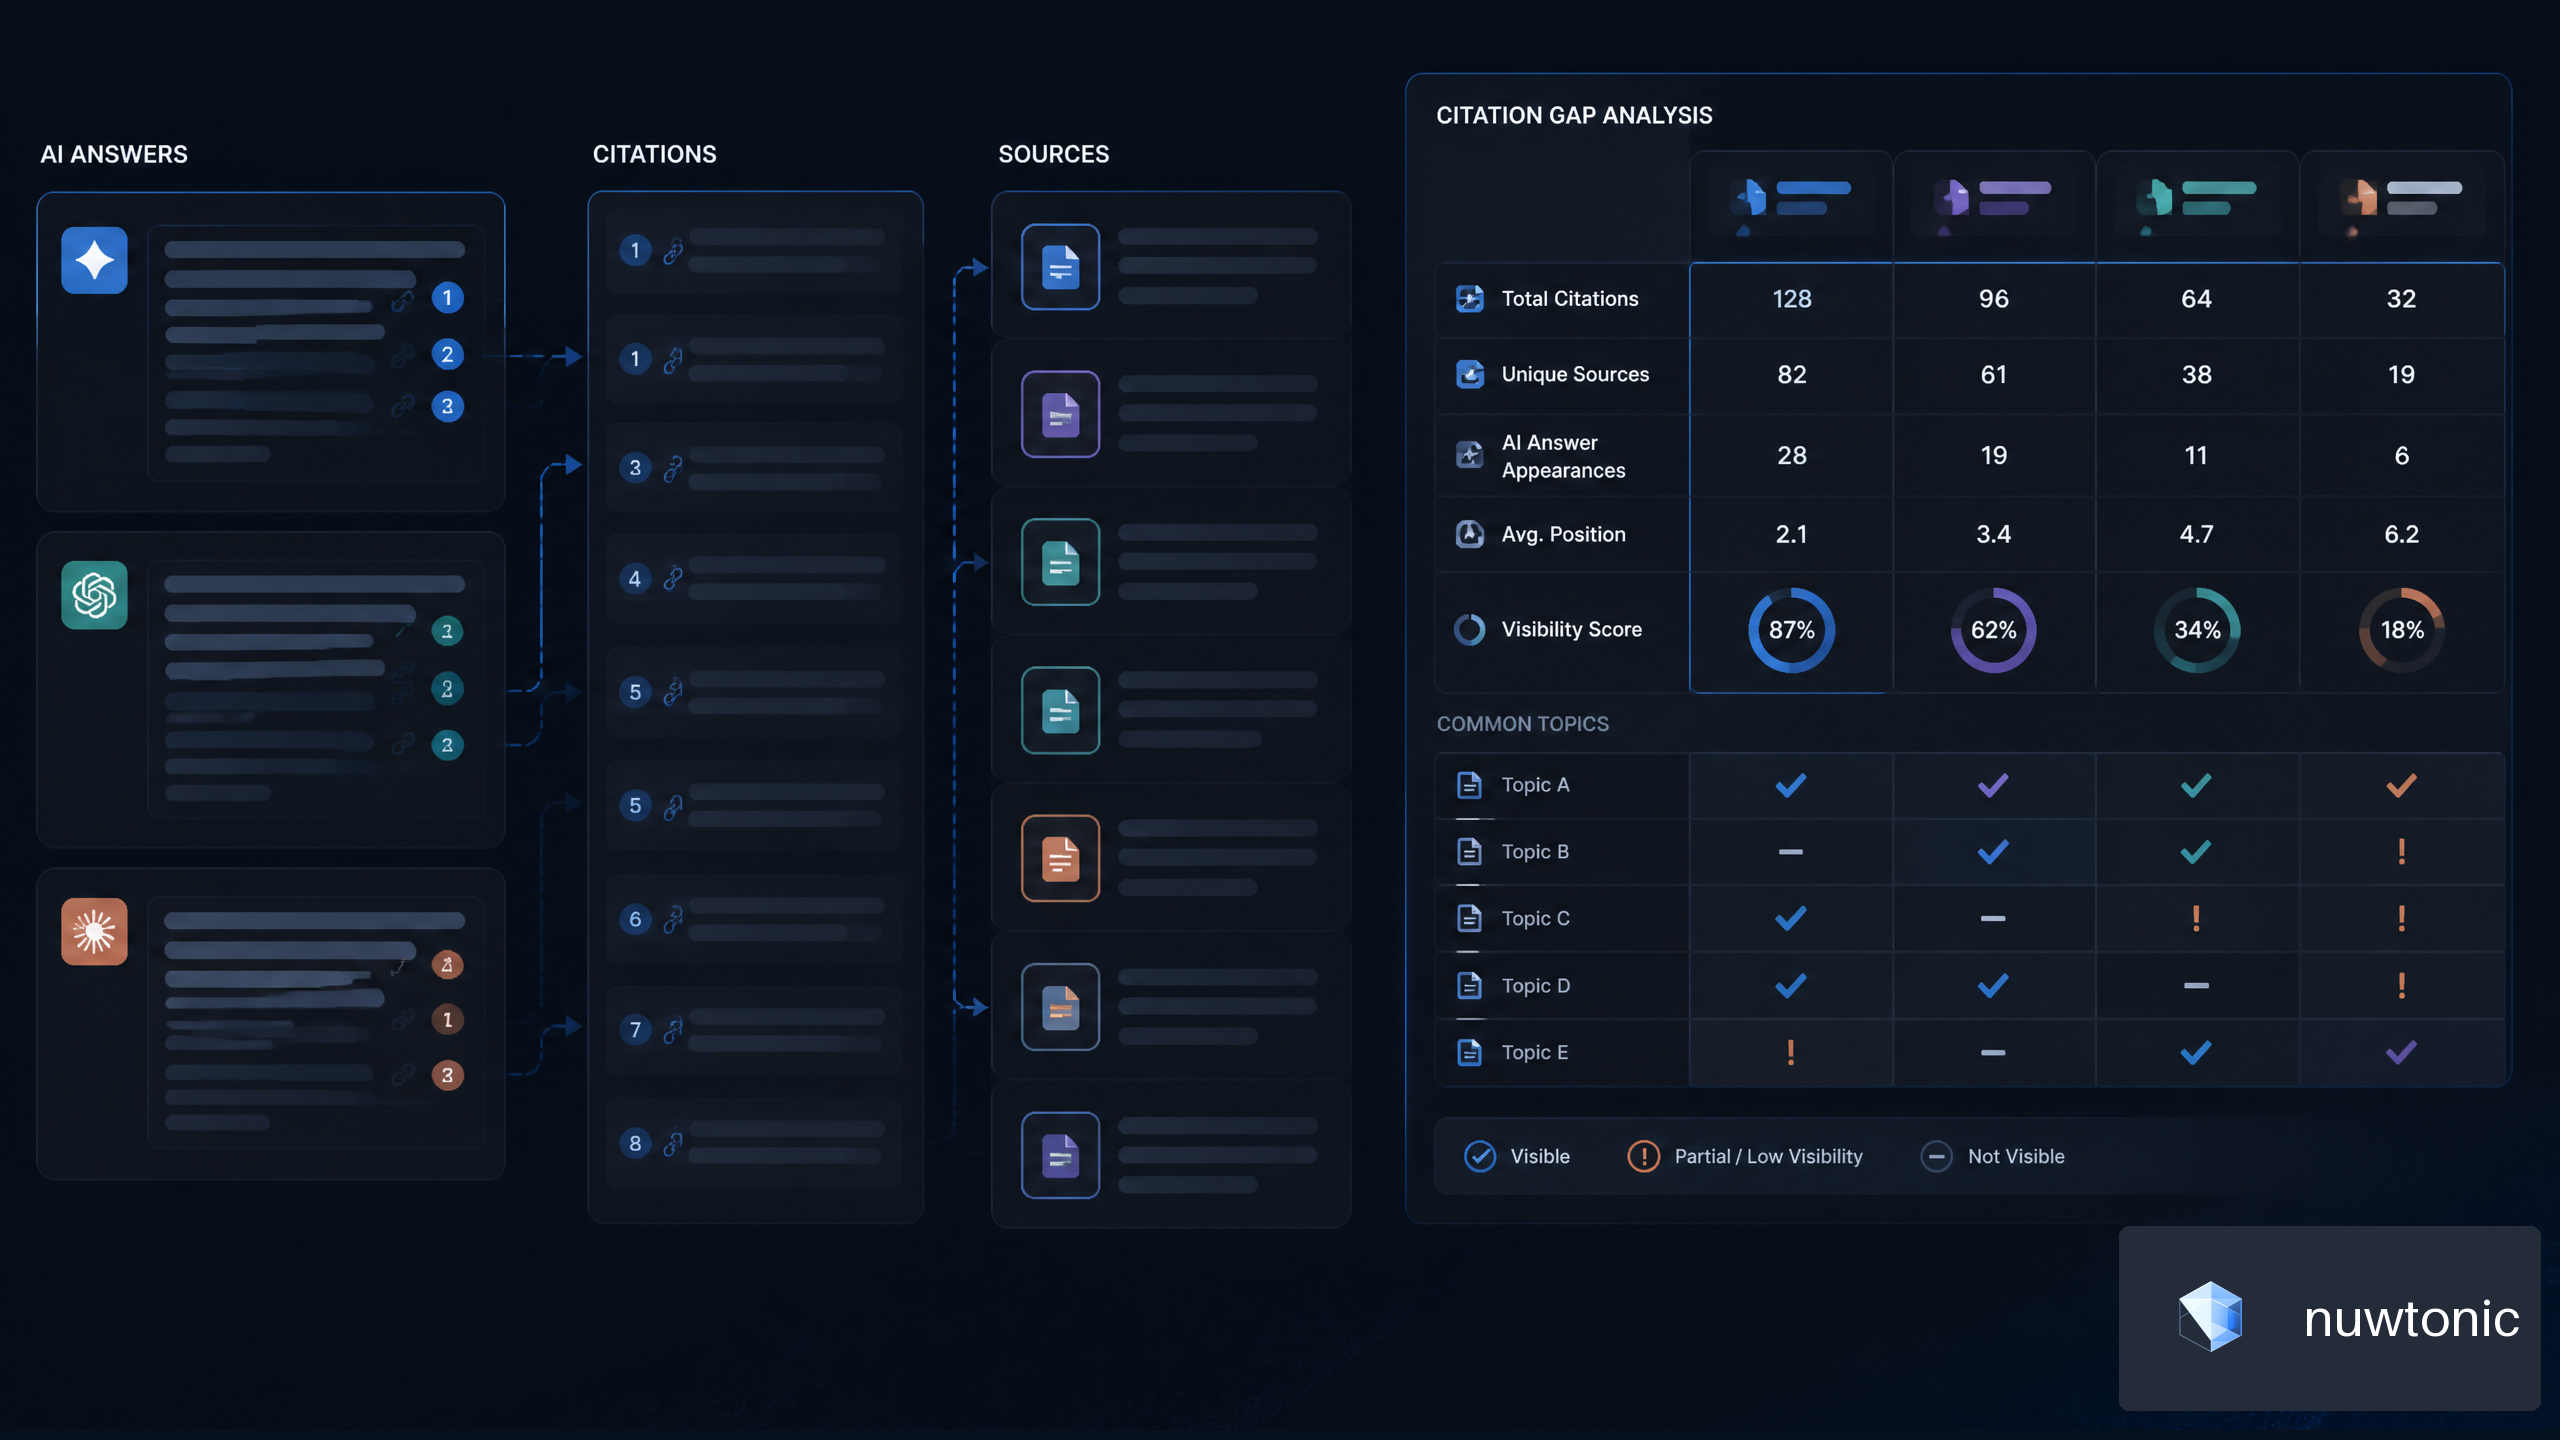
AI search creates a new measurement problem, but it doesn't require a new logic. The same normalization rule still works. You count how often a brand appears in generated responses, compare that against competitor appearances in the same prompt set, and calculate the percentage of total category visibility captured. Nuwtonic's own AI visibility guide frames this as SOV = your brand's AI mentions divided by total category AI mentions, multiplied by 100, which maps cleanly to the same denominator-first thinking used in SEO and PR. Nuwtonic's AI search visibility guide
Use prompts as the market definition
Prompt design is the denominator in AI search. If the prompt set doesn't represent the category's core questions, the result won't reflect market reality. The practical move is to build a fixed prompt set, then run the same prompts across the same engines for your brand and the competitors you care about.
That fixed set needs to stay stable across reporting cycles. Otherwise, you end up comparing one sample of questions against another, which makes the score drift for reasons that have nothing to do with visibility. Repeated runs matter too, because model outputs vary. If you only sample once, you're benchmarking randomness as much as performance.
Count appearances and citations separately
AI visibility isn't just about being named. In many cases, the cited source matters as much as the mention itself. That's especially true when the product team cares about source selection, not just brand recall. I'd track two views, brand appearances in the generated answer and source-level citations where the model points users back to a URL.
Operational note: repeated prompt runs are not optional when the model can rewrite an answer the next time you ask the same thing.
Platform choice starts to matter. A tool that can centralize tracking across ChatGPT, Perplexity, Gemini, Google, and Grok gives you a much cleaner denominator than a hand-built sample sheet. It also lets you compare how often your brand appears as models evolve. The value isn't just faster reporting. It's consistency across engines, prompts, and time windows.
For teams already watching AI visibility, the bigger strategic win is connecting those findings to remediation. If a competitor appears more often in answer sets, that's a content and structure issue, not just a reporting issue. The data should lead to specific fixes, like page rewrites, entity clarification, or better source coverage.
Manual Calculations Versus Automated SOV Platforms
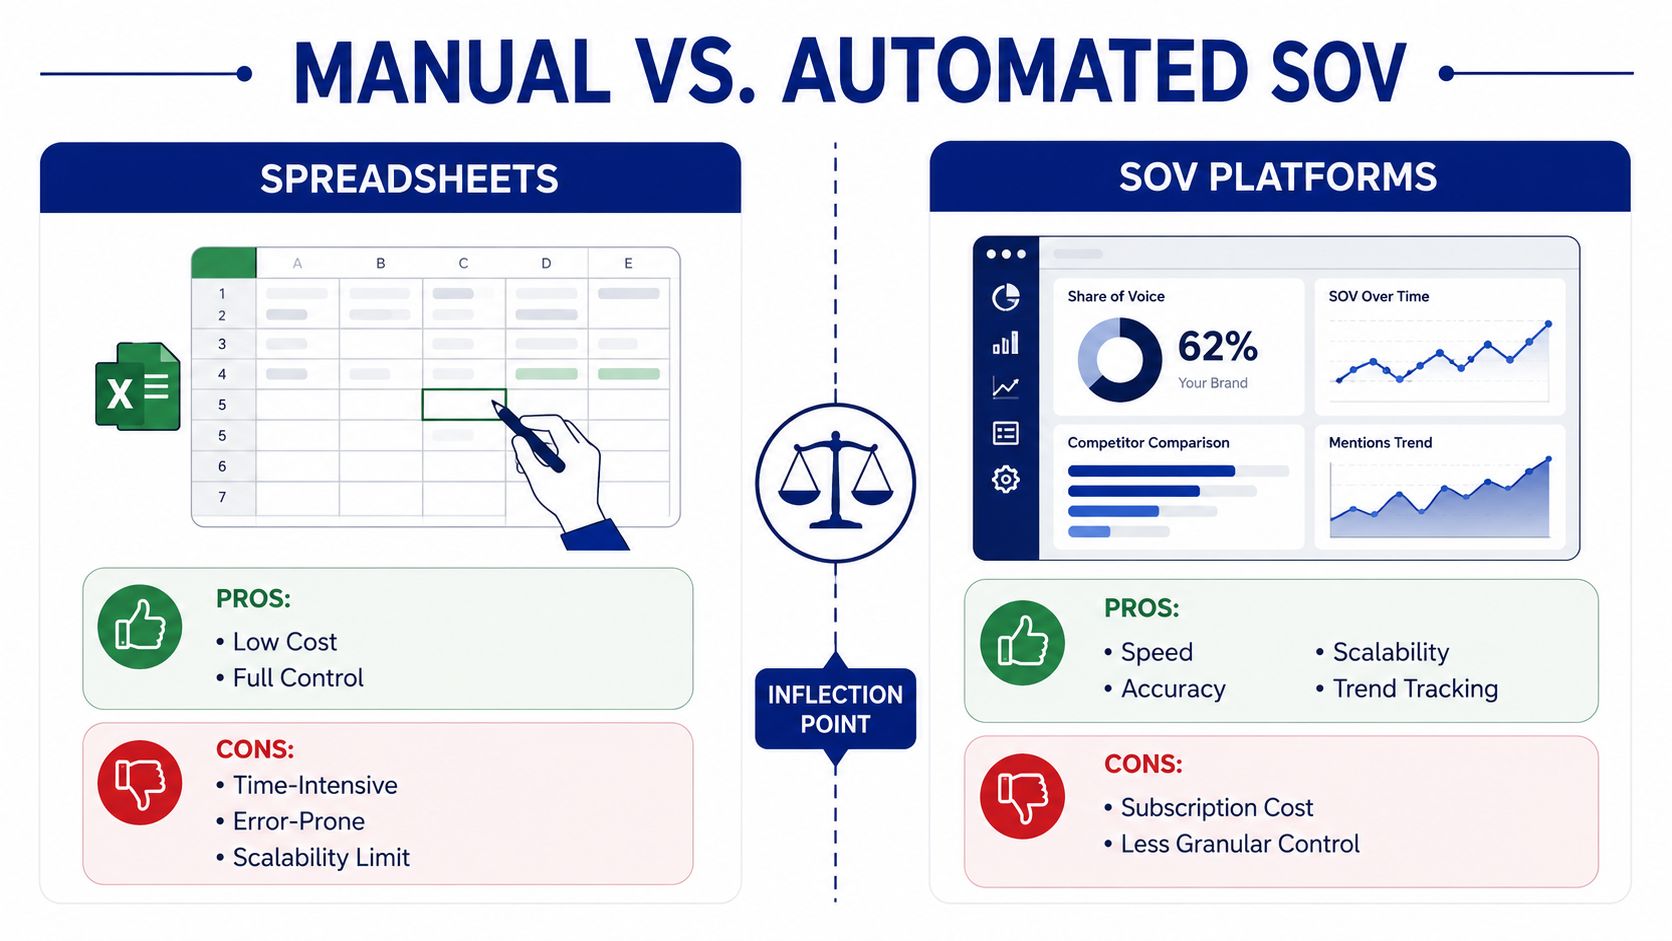
Spreadsheets are fine until they aren't. Teams can hand-calculate SOV for a single channel without much pain, but the moment you try to reconcile SEO, social, PR, and AI search in one reporting frame, the manual process gets brittle. The hidden costs aren't just labor. They're stale data, drifting competitor lists, and inconsistent methods across channels that make the rollup look cleaner than it really is.
Use manual methods for learning, not for scale
Manual calculation is useful when you're still defining the market and testing which metric best reflects visibility. It gives you full control over the numerator and denominator, and that matters when the category is messy. The downside shows up quickly once more than one person touches the file.
A spreadsheet workflow usually breaks in the same places:
- Competitor drift: one analyst adds a rival, another removes one.
- Source drift: search data, social data, and AI data get mixed without a consistent frame.
- Refresh lag: the report is accurate on the day it's built, then gets stale.
- Method drift: CTR assumptions, weighting, or time windows change without version control.
Upgrade when the report needs governance
Automation becomes the right move when the metric needs to be trusted by people who don't build it. That's usually when leadership starts using SOV for budget allocation, content planning, or competitive review. At that point, the platform matters less for convenience and more for auditability.
The useful feature set is straightforward. You want API access for custom dashboards, review-before-deploy controls for any fixes, and a way to connect measurement directly to action. Nuwtonic is one option in that space because it ties visibility tracking to ranked issues and content workflows, instead of leaving the data stranded in reports. Other stacks may separate rank tracking, social listening, and AI search monitoring, which can work, but only if your team is disciplined about method alignment.
The decision point is this: does the report describe the market, or does it just summarize a pile of exports? If it's the second one, automation is probably overdue.
Common Mistakes That Invalidate Your SOV Numbers
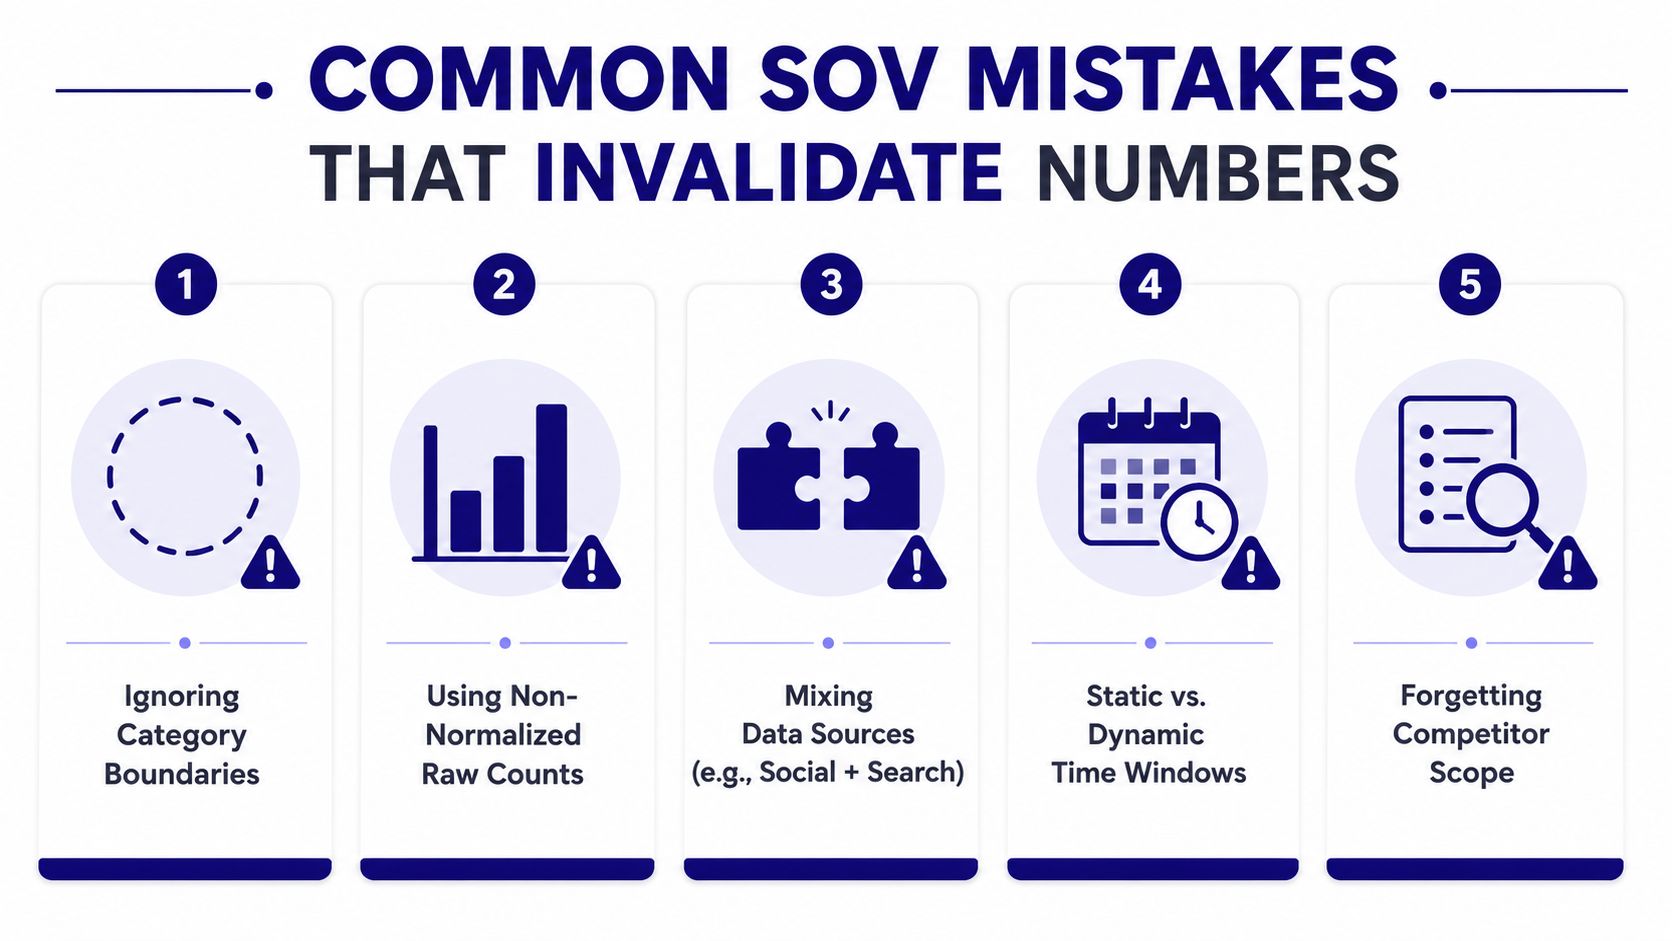
Bad SOV numbers often look polished because the formula is simple. The failure happens in the setup. Teams mix categories that shouldn't be combined, swap competitor lists between periods, or treat raw counts like normalized percentages. The result is a report that sounds authoritative and still misleads everyone reading it.
Watch the denominator before you trust the trend
If the market boundary changes, the trend line changes with it. That's not growth or decline, it's a new calculation. The same problem shows up when teams compare SOV across channels without acknowledging that each channel has a different total addressable market.
Raw rank positions create a different kind of error. They feel concrete, but they don't reflect demand. A site can rank well on low-volume terms and still lose the share battle to a competitor ranking lower on higher-volume terms. That's why demand weighting is not a nice-to-have.
A strong-looking percentage is worthless if the market definition moved underneath it.
Run a quick validation before reporting
I use a short pre-flight check before anything goes to stakeholders:
- Confirm the category boundary. The same market definition should apply to every period in the comparison.
- Check the competitor set. If a new entrant is included this month, note it explicitly.
- Verify one metric per channel. Don't mix social mentions with search traffic in the same numerator.
- Inspect the time window. A rolling window and a fixed calendar window won't tell the same story.
- Review weighting rules. If outlet importance or CTR curves changed, the report needs a note.
These failures are easy to prevent, but only if someone owns the method. That ownership matters more than the tool. A team can build the prettiest dashboard in the world and still present bad math if nobody validates the denominator before the slide goes out.
Building a Sustainable SOV Reporting Cadence
A useful SOV system doesn't just produce numbers, it tells teams when to act. Weekly tracking usually catches competitive moves early enough to matter, while monthly reporting can be useful for leadership review and planning. The mistake is using one cadence for everything. SEO, social, PR, and AI search do not move at the same speed, so a single blanket rhythm usually creates either alert fatigue or blind spots.
Separate channel views from the blended rollup
The report should keep channel-level SOV visible on its own, then show the blended view only after the underlying methods are clear. That way, the SEO team can see organic movement without being distorted by AI search changes, and the PR team can see mention share without inheriting search noise.
Ownership should follow the data source. SEO owns organic search SOV, social owns social mention share, PR owns media coverage, and whoever is responsible for AI visibility owns prompt tracking and citation sampling. If one person is merging all of it, you usually lose method discipline.
A strong reporting pack includes three things:
- Current share by channel with the same time window each period.
- Movement versus the prior period with a short note on what changed.
- Action items tied to the channel that moved.
For teams that need a tighter loop between reporting and execution, the SEO dashboard reporting guide is worth looking at alongside the measurement model. The important thing is not just showing SOV. It's connecting the report to the fix.
Trigger action only when the change matters
Not every dip deserves a fire drill. I'd trigger content or campaign review when the decline is sustained, or when a competitor's gain lines up with a visible coverage gap. That's where the report becomes operational instead of decorative.
For AI analytics specifically, I'd keep an eye on sampling bias and overconfident interpretation. A useful reference for that kind of caution is HelpWithMetrics on AI analytics pitfalls, especially if your team is turning model outputs into business decisions. The reporting cadence should protect you from over-reading noisy data, not amplify it.
The cleanest setup is one owner for method, one owner for distribution, and one owner for follow-up. If those roles are clear, SOV stops being a vanity metric and starts becoming a decision system.
If you want a single workspace that connects SEO visibility, competitor gaps, and AI search tracking without forcing your team to stitch everything together by hand, Nuwtonic is built for that workflow. It combines measurement, reviewable fixes, and content actions so SOV findings can turn into actual remediation instead of another static report.