
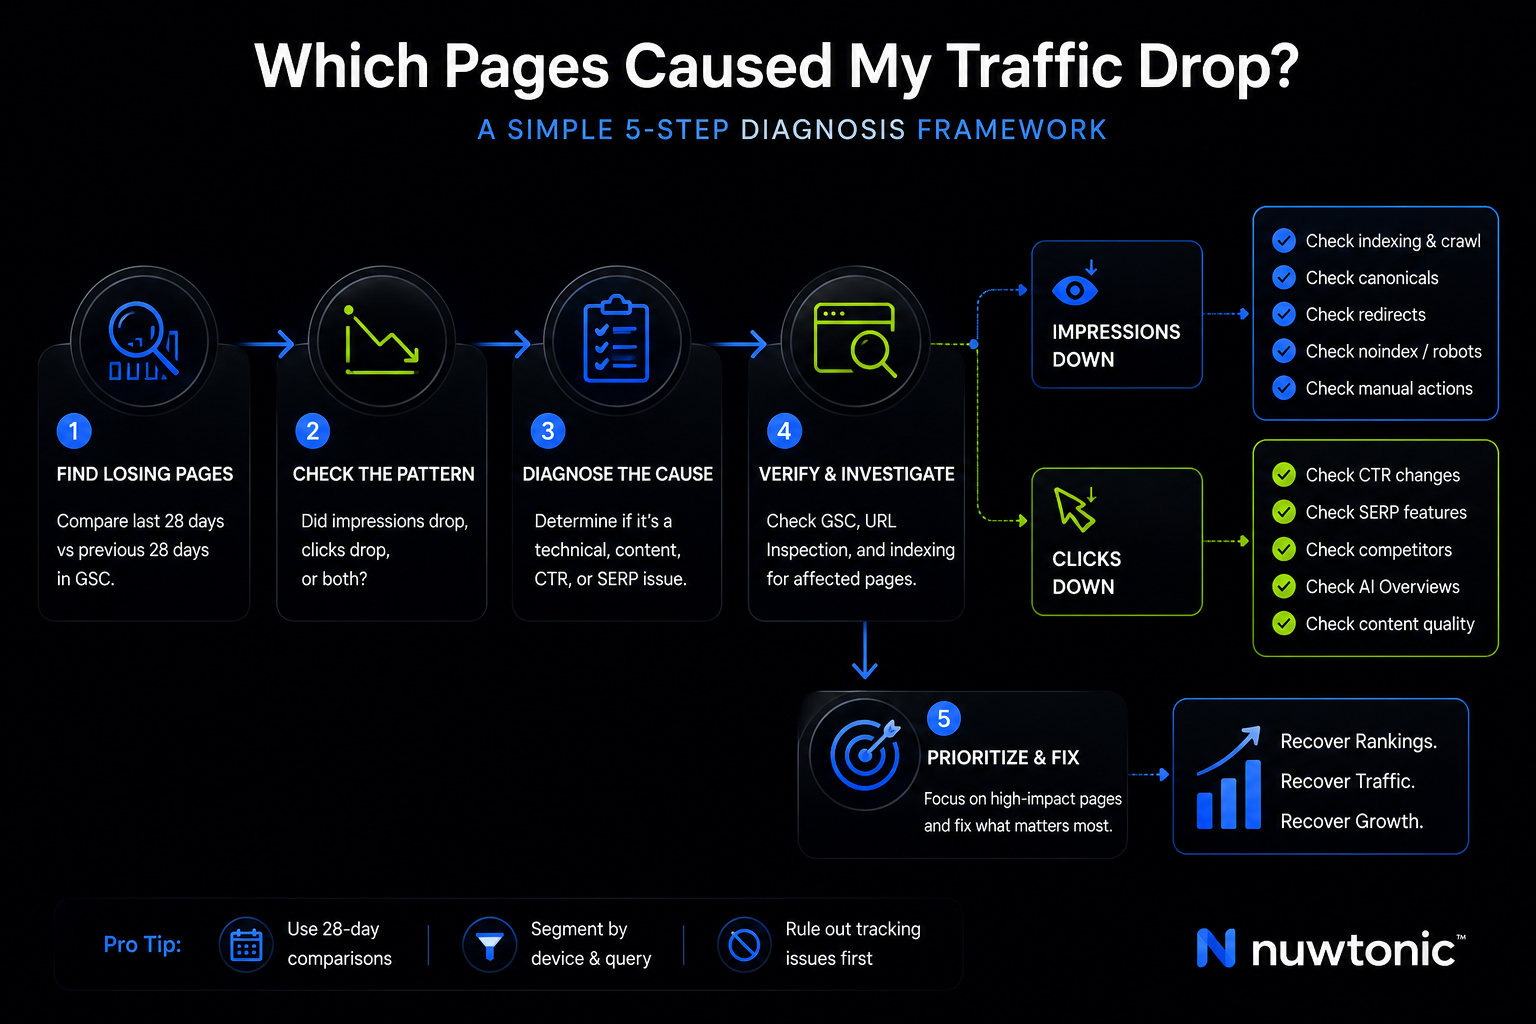
If you’re asking which pages caused my traffic drop?, the shortest honest answer is this: compare page-level performance across two periods, sort by loss, then verify whether the problem is measurement, visibility, CTR, or a technical break. Look, it’s simple: panic is optional; a process is not.

In my experience, most teams waste the first few days staring at top-line organic traffic charts and debating whether Google is being rude again. Meanwhile, the real answer is sitting at the URL level. Google’s own debugging guidance points you toward page-level analysis and URL inspection when a specific page loses traffic, and that’s still the right starting point in 2026. Nuwtonic is useful here because it pulls your Google Search Console data into a workspace that already highlights top movers, device gaps, zero-CTR queries, and page clusters—so you don’t spend half the day exporting CSVs before the actual diagnosis even begins.
TL;DR Summary
Start with page-level loss, not sitewide averages.
Compare last 28 days vs previous 28 days for recent drops; Scalemee’s workflow is still one of the cleanest for this kind of recency check.
Then compare same period year over year to rule out seasonality.
Separate pages that lost impressions from pages that lost only clicks.
If impressions are down, check crawlability, canonicals, indexing, redirects, and noindex issues.
If impressions are flat but clicks are down, think CTR, SERP changes, competitors, or AI Overview impact.
Verify tracking before blaming SEO—InTeam’s debugging order gets this right.
Nuwtonic helps by surfacing top losing pages, mobile vs. desktop gaps, zero-CTR opportunities, topic clusters, and URL-specific audit/fix recommendations based on your real GSC data.
Key Takeaways
• The pages that caused the drop are usually the pages with the biggest negative click or session delta, not necessarily the pages with the worst average position.
• A “significant” drop needs context. I usually treat it as worth urgent review when a page loses more than 20% traffic and the absolute loss is meaningful to the business.
• Impressions down usually means visibility or indexing trouble.
• Clicks down with stable impressions usually means CTR pressure, SERP changes, competitor movement, or AI Overview cannibalization.
• Blog pages dropping while product pages hold steady often points to content freshness, AI search behavior, or informational-query volatility—not a sitewide technical collapse.
• Nuwtonic is strongest at the exact front half of this problem: identifying which URLs fell, segmenting the loss pattern, and giving page-level direction on what to fix next.
Table of Contents
What “Which pages caused my traffic drop?” really means
It’s a page-level diagnosis problem, not a dashboard problem
Here’s the thing: sitewide traffic drops are summaries. They’re symptoms. The actual cause usually lives inside a relatively small set of URLs.
When someone asks me which pages caused the drop, I’m really translating that into four smaller questions:
Which URLs lost the most organic traffic volume?
Did they lose impressions, clicks, or both?
Are those URLs connected by page type, device, or query intent?
Is the pattern pointing to tracking error, technical SEO, content quality, SERP shift, or algorithm update?
That framing matters because the fix for a blog post that lost CTR is nothing like the fix for a product page stuck behind a redirect chain.
A real drop needs a threshold, not vibes
A lot of articles skip this part, and that’s annoying. Not every red number is a crisis.
I recommend using a simple triage table:
Signal | Likely Meaning | Investigate Now? |
|---|---|---|
Less than 10% decline and low absolute clicks | Normal fluctuation or noise | Usually no |
10% to 20% decline with moderate traffic | Possible issue forming | Yes, but not panic mode |
More than 20% decline and meaningful business impact | Real drop | Yes |
More than 50 clicks lost on a key URL in 28 days | High-priority page-level problem | Yes, urgently |
Traffic loss isolated to 2 to 10 pages | Specific URL or template issue | Yes |
Traffic loss across a whole section | Content, template, or algorithm pattern | Yes |
Your mileage may vary—an enterprise site and a niche B2B site won’t use the same absolute thresholds. But if you don’t define significance up front, you’ll chase noise.
Recent drop vs seasonal drop changes the whole investigation
Scalemee’s advice to compare last 28 days vs previous 28 days is solid for spotting recent losers. I use that all the time because it catches the immediate damage fast. But that should not be your only comparison.
You also need this second view:
Comparison Window | Best Use | Weakness |
|---|---|---|
Last 28 days vs previous 28 days | Recent drop detection | Can confuse seasonality with decline |
Same month this year vs same month last year | Seasonality check | Slower to reflect sudden change |
Last 7 days vs prior 7 days | Immediate incident response | Too noisy for many sites |
Post-change period vs pre-change period | Migration, release, redesign diagnosis | Needs a known event date |
Look, if you run an e-commerce site and compare January to December, you might just be diagnosing Christmas.
The fastest way to find losing pages
Use GSC first and sort by page-level loss
Google Search Console is usually the cleanest place to start for organic traffic diagnosis because it shows clicks, impressions, CTR, and average position by URL. Google’s own debugging documentation says that when a specific page loses traffic, you should inspect the page directly and check crawlability and canonicalization. That’s page-level debugging, not storytelling.
The practical workflow is straightforward:
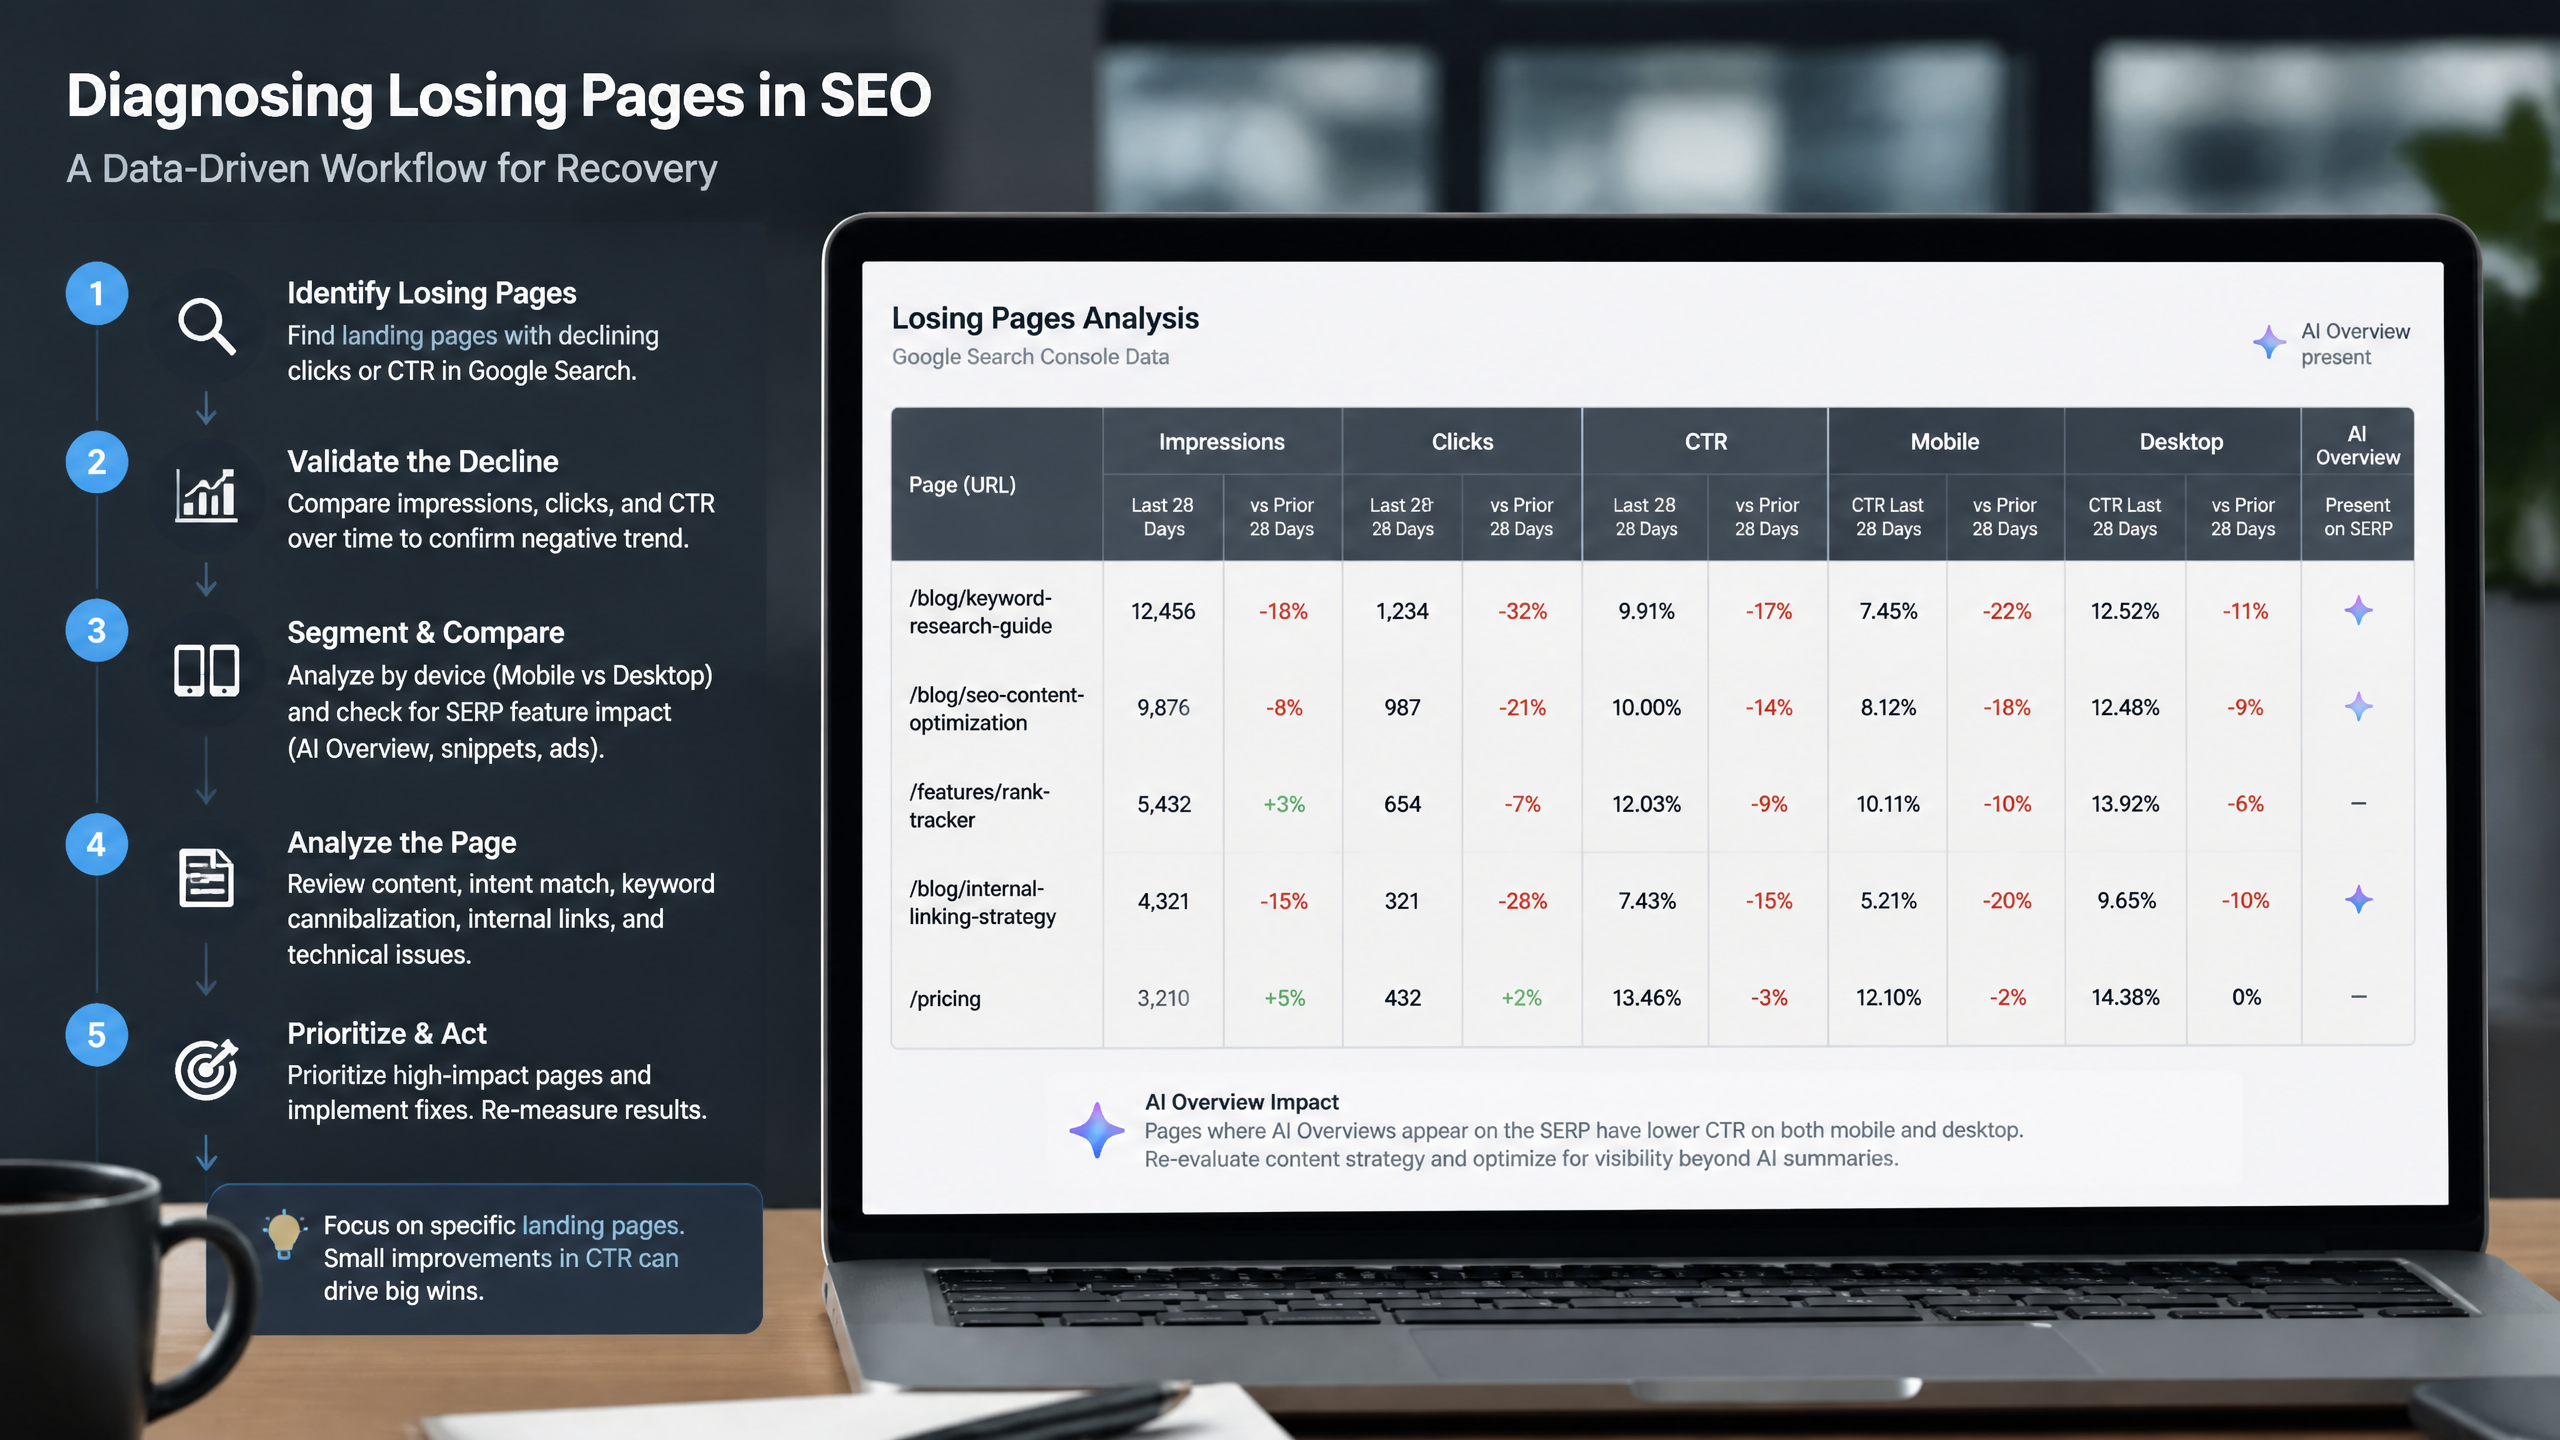
Open Search results in GSC.
Set the date comparison to last 28 days vs previous 28 days.
Go to the Pages tab.
Sort by Clicks Difference, lowest first.
Pull out the URLs with the biggest negative movement.
Check whether the same page also lost impressions.
Segment by device and query before deciding on the cause.
Google’s debugging guide aligns with that logic, and Scalemee specifically recommends the 28-day comparison for recent page-level decline analysis. If you want Google’s process directly, this Google Search traffic debugging guide is the official reference.
Use GA4 to validate which landing pages lost sessions
GSC tells you about search performance. GA4 tells you whether those pages also lost sessions as entry points. Those are related, but not identical.
This is where teams get tripped up. A page can lose GSC clicks but still look odd in GA4 because of attribution setup, consent mode effects, or tagging issues. InTeam’s guidance is right to put measurement verification first before deeper diagnosis. I’ve seen people spend a week rewriting pages when the problem was a tracking configuration mistake. That week never comes back.
Use this workflow in GA4:
Go to acquisition or landing page reporting.
Filter for organic search where possible.
Compare the same period ranges you used in GSC.
Sort by landing page sessions or session delta.
Match the losing URLs against your GSC list.
Plausible makes a similar point with its Entry Pages view, which is useful conceptually even if you’re not using Plausible. The principle is the same: identify the exact entry URLs that dropped.
Exporting still matters—yes, even in 2026
I know, I know. We all wanted dashboards to save us from spreadsheets. Yet exporting still helps because pattern recognition is easier when you can sort, tag, and highlight across many URLs.
A simple export review lets you classify pages by:
• Page type
• Traffic lost
• Impressions lost
• CTR lost
• Device impact
• Revenue impact
• Last updated date
• Redirect or indexation status
SEO community workflows keep recommending “export and highlight the biggest losers” because it works. SEO Mafia Club and similar practitioner playbooks have been saying the same thing for years: isolate the pages with the biggest drop first, then note whether the affected URLs belong to the same page type.
How to read the pattern behind the drop
Impressions down vs clicks down tells you where to look
This is the fork in the road.
A page losing impressions usually means reduced search visibility. A page losing clicks with stable impressions usually means the page is still showing up but getting picked less often.
Pattern | What It Usually Means | First Checks |
|---|---|---|
Impressions down, clicks down | Lost visibility or indexing issue | URL Inspection, noindex, canonical, redirects, crawlability |
Impressions stable, clicks down | CTR drop or SERP shift | Title/snippet, AI Overview, competitor movement |
Impressions up, clicks flat | Exposure increased but relevance weak | Query match, title quality, intent mismatch |
Desktop stable, mobile down | Device-specific issue | Mobile UX, redirects, rendering |
Blog down, product stable | Informational volatility | Content freshness, AI Overview, competitor content |
A 2025 WordPress-focused analysis noted that when impressions stay the same but clicks drop, you’re usually looking at a SERP change or a competitor overtaking you. That matches what I see in practice. Sometimes nothing is “broken.” Users just found something they liked better.
Use URL Inspection before you touch the content
Most people overlook the importance of content quality when diagnosing traffic drops; it’s often the root cause. But—and this is important—you should still rule out technical breakage first.
Google Search Console Help is explicit here: if traffic to a specific page drops, inspect whether that page is canonical and crawlable. If impressions dropped, Google also recommends using URL Inspection to verify whether the page can be crawled.
Check these items in order:
Is the URL indexed?
Is it the selected canonical?
Is there a noindex tag?
Is robots.txt blocking crawl access?
Did the URL change or redirect?
Is the page returning 200, 404, or something messy?
Does Google see the same page content you think users see?
One ugly edge case people miss is the soft 404. The page loads, looks like a page, but behaves enough like “missing content” that Google backs away. Fair warning: soft 404s are sneaky.
Algorithm update or technical issue? The pattern usually tells on itself
Surmado’s diagnostic data found that algorithm updates account for 50% of traffic drop cases, while technical issues account for 20%. I wouldn’t treat those percentages as universal law for every site, but they’re directionally useful. They tell you not to assume every drop is a broken tag—and not to assume every drop is Google punishing you either.
Here’s how I separate them:
Signal | More Likely Algorithm | More Likely Technical |
|---|---|---|
Many pages across one intent class drop together | Yes | Sometimes |
A few URLs or one directory vanish suddenly | Rarely | Yes |
Rankings slide gradually | Yes | Sometimes |
Traffic drops immediately after release or migration | Rarely | Yes |
URL Inspection shows indexing/canonical issue | No | Yes |
Drop lines up with confirmed Google volatility | Yes | Maybe |
I’ve seen many sites panic over minor algorithm changes when a simple technical fix could have saved their traffic. Skepticism helps here.
Where Nuwtonic helps most
It surfaces the losing URLs without making you stitch five tools together
Here’s the thing: the hardest part of page-drop diagnosis is often not the theory. It’s the workflow friction.
You connect GSC, and suddenly you’re in a workspace where Nuwtonic is already surfacing:
• Top movers
• Zero-CTR queries
• Mobile vs. desktop ranking gaps
• Topic clusters
• Cannibalization issues
• Trust-signal patterns
That matters for this specific question—which pages caused my traffic drop?—because the first step is isolating page loss fast. Nuwtonic reduces the manual hunting phase by organizing the actual site data around those patterns from the start.
It helps separate page-loss types that look similar in raw GSC
Raw GSC is good, but it’s not generous. It gives you data; it does not give you much interpretation.
Nuwtonic’s strength is that it helps sort page drops into different buckets that require different action:
Nuwtonic Capability | How It Helps With Traffic-Drop Pages | Why It Matters |
|---|---|---|
Top movers analysis | Identifies URLs with the sharpest gains and losses | Faster triage |
Mobile vs desktop ranking gaps | Reveals device-isolated page losses | Avoids wrong fixes |
Zero-CTR query detection | Flags pages still visible but not earning clicks | Useful for CTR and AI Overview impact |
Topic cluster mapping | Shows if losing pages belong to the same content area | Helps identify section-wide decay |
Cannibalization detection | Reveals when your own pages compete against each other | Useful when one URL quietly steals from another |
On-page audit guidance | Suggests what to change on the affected URL | Moves from diagnosis to action |
That means less time wondering whether three dropping articles are random and more time seeing that they all belong to the same stale cluster.
It is especially useful for the 2026 AI Overview problem
This is one area where older traffic-drop playbooks are a bit behind reality.
A 2026 High Visibility analysis found that roughly 80% of traffic drops traced back to either AI Overviews overtaking informational queries or outdated content on specific pages. The same analysis reported that 8.69% of commercial searches triggered AI Overviews. That doesn’t mean every declining page is an AI casualty. It does mean you should stop assuming stable rankings guarantee stable clicks.
If a page’s impressions are stable, average position is broadly similar, but clicks and CTR are down, one plausible explanation is that the query now gets partially answered on the SERP by an AI Overview. Nuwtonic’s AI search visibility and citation gap analysis are relevant here because they help you understand whether your content is being cited or bypassed in AI-driven answer environments.
Look, this depends heavily on query type. For a pure informational article, AI answer boxes can shave off a lot of curiosity clicks. For a product comparison page with commercial intent, the outcome may be different. That’s why page-by-page analysis matters.
How I prioritize pages for [traffic recovery](https://nuwtonic.com/features/traffic-bring-back)
Start with business impact, not just percentage decline
A page that falls from 10 clicks to 2 has an 80% drop. A page that falls from 2,000 to 1,400 has a 30% drop. Which one gets attention first? Unless the tiny page drives absurdly high-value conversions, the second page wins.
This is my working prioritization model:
Absolute traffic loss
Commercial or lead value of the page
Whether the issue affects a cluster or one page
Likelihood of fast recovery
Technical severity
Group affected pages by type before making fixes
SEO Mafia Club’s guidance about identifying which page types were hit is more important than it sounds. If your drop is isolated to /blog/ pages while /product/ pages hold steady, that narrows the field quickly.
Use a classification table like this:
Page Type | Typical Drop Causes | Best First Action |
|---|---|---|
Blog posts | Outdated content, AI Overview impact, weak CTR | Update content, improve intent match, review SERP |
Product pages | Redirect issues, thin content, indexing problems | Technical checks, strengthen page copy |
Category pages | Cannibalization, internal linking shifts, template changes | Audit internal links and template signals |
Guides/comparisons | Competitor overtakes, SERP feature crowding | Improve differentiation and snippet appeal |
Legacy URLs | Migration errors, broken redirects, 404s | Redirect and indexation audit |
Nuwtonic’s topic clustering and audit layer help here because they show whether losers belong to a content pattern rather than acting like isolated incidents.
Decide whether the page needs a fix, a rewrite, or a strategic downgrade
Not every losing page deserves rescue. Some are obsolete. Some target dead topics. Some were weak from the beginning and only looked successful because the SERP was easier two years ago.
I usually sort pages into three actions:
Decision | When to Choose It | When to Avoid It |
|---|---|---|
Fix technically | Indexing, redirects, canonical, mobile issues are present | If the page is obsolete or intentionally retired |
Refresh and expand content | Topic still matters and page has link equity or demand | If search demand itself has collapsed |
Consolidate or retire | Multiple weak pages overlap or intent changed permanently | If the page is a strong converter with recoverable demand |
Data analysis tools can provide insights, but nothing beats a thorough manual review of the site’s key pages. I still read the affected page, search the target keyword myself, and compare the current SERP. Machines help me get there faster; they don’t replace that judgment.
Common scenarios I keep seeing
The accidental noindex disaster
One situation I keep seeing is a site owner noticing a 40% organic traffic drop, digging into GSC, and finding that three blog posts lost around 90% of their clicks. The first instinct is usually “Google update.” But after inspecting the URLs, the culprit turns out to be a CMS deployment that added a noindex tag. Remove it, request reprocessing, wait about two weeks, and traffic starts recovering.
This is exactly why I tell people: don’t rewrite content before checking the page state.
The mobile-only page loss nobody notices at first
Another common pattern looks like this: sessions on /product/ pages fall, but only on mobile. Desktop looks fine, so everyone assumes demand is down. Then a device-segmented review shows a broken mobile redirect or rendering problem. Fix the mobile redirect issue, and you recover around 85% of the lost mobile traffic.
Nuwtonic’s device-gap analysis is useful in this exact scenario because it highlights mobile vs. desktop ranking gaps early instead of making you uncover them manually after hours of filtering.
The flat-impression, falling-clicks problem
This one frustrates people because nothing looks obviously broken. The page still ranks. Impressions are mostly stable. Yet clicks slide.
I’ve seen cases where the response was to rewrite the title tag immediately. Sometimes that helps. Sometimes the real issue is that a competitor built a better page and stepped ahead in the SERP, or an AI Overview now absorbs part of the click demand. In one recurring type of case, shifting the page toward stronger long-tail coverage recovered about 30% of traffic after a competitor displaced the original article.
That’s the uncomfortable truth: some drops are not bugs. They’re market pressure.
FAQ
How do I sort Google Search Console to find the pages with the biggest traffic drop?
Open the Search results report.
Compare last 28 days vs previous 28 days.
Click the Pages tab.
Sort by Clicks Difference from lowest to highest.
Google’s debugging documentation specifically supports using page-level comparisons, and practitioner workflows built around GSC commonly treat Clicks Difference as the fastest way to identify investigation targets.
What is the difference between a drop in impressions and a drop in clicks for a specific page?
• Impressions down usually means the page lost visibility, indexing, or rank presence.
• Clicks down with stable impressions usually means CTR declined because of SERP features, AI Overview behavior, snippet weakness, or competitor pressure.
That distinction changes the fix completely.
Should I compare to the previous month or the same month last year?
Use both.
• Previous 28 days is best for recent incident detection.
• Same period last year is best for checking seasonality.
Scalemee’s 28-day comparison is a strong operational default for fresh drops, but I would not rely on it alone if your niche has seasonal demand.
How do I use URL Inspection to diagnose a page that lost traffic?
Check whether the page is:
Indexed
Crawlable
Canonical to itself or to the correct URL
Free of noindex directives
Returning the expected page state
Google’s own recommendation is to use URL Inspection when a specific page loses traffic or impressions. If you want the official process, Google explains it in this page-loss investigation documentation.
Why did my blog pages drop in traffic but my product pages stayed stable?
Usually one of these:
• Informational queries became more competitive
• Content became outdated
• AI Overviews reduced clicks on answer-style pages
• The affected blog posts share a weak template or intent mismatch
This kind of page-type split often points to a content problem rather than a whole-site technical one.
Could an AI Overview be causing a page to lose traffic even if ranking is stable?
Yes. Especially in 2026.
If impressions and average position are relatively stable but clicks and CTR are down, AI Overview exposure is one plausible cause. High Visibility’s 2026 analysis tied a large share of traffic drops to AI Overview displacement and stale content. This is one reason Nuwtonic’s AI visibility monitoring is relevant for page-level drop analysis—not because it replaces GSC, but because it adds context GSC does not show directly.
How do I check if a specific page was accidentally marked noindex?
Inspect the page in GSC.
Review the source code or rendered HTML.
Confirm whether a meta robots noindex or header-level noindex exists.
Recheck CMS or plugin settings if the tag appeared recently.
This is one of the most common “sudden page collapse” issues I see after redesigns and plugin updates.
What evidence suggests an algorithm update rather than a technical error?
Evidence | More Consistent With Algorithm | More Consistent With Technical Error |
|---|---|---|
Broad decline across many similar pages | Yes | Sometimes |
Exact timing after site release or migration | Rarely | Yes |
URL inspection errors | No | Yes |
Content-quality pattern across old pages | Yes | Sometimes |
Device-only impact | Rarely | Yes |
Surmado’s analysis found algorithm updates were involved in about 50% of diagnosed drops, which is a useful reminder not to overfocus on code-level failure.
How can I tell if a specific page lost traffic because it went 404?
• Check the URL directly in your browser
• Inspect the response status
• Review crawl/indexation in GSC
• Look for redirect changes or deleted-page logs
A true 404 usually causes an abrupt collapse. A soft 404 can be trickier and may require a manual review of the live page plus inspection data.
Do I need to check mobile usability if only desktop traffic dropped for a page?
Yes—but with nuance.
If only desktop dropped, mobile usability is probably not the first suspect. Still, segment by device before making assumptions. Sometimes reporting noise or mixed-template behavior creates misleading patterns. Nuwtonic’s device-gap view is helpful because it surfaces those asymmetries faster.
How do I identify if a specific page lost traffic due to missing backlinks?
Look for:
• Lost referring domains to the affected URL
• A ranking drop on competitive terms
• Stable indexation but weaker authority signals
• Competitors gaining stronger link support
This is usually a secondary check after you rule out indexation and content issues.
What is the first step before blaming pages for a traffic drop?
Verify measurement integrity.
InTeam’s process gets the order right: confirm that analytics and tracking are functioning before you conclude that SEO performance changed. I’ve seen too many false alarms caused by GA4 setup problems.
Can a redirect chain cause a specific page to lose all its traffic?
Absolutely.
A broken redirect, redirect chain, or migration mismatch can wipe out traffic to a URL—or transfer less value than expected. This is especially common on legacy pages after redesigns and domain changes.
How do I filter GA4 to see which landing pages lost the most sessions?
Open a landing page or acquisition report.
Filter for organic search.
Compare the drop period against the prior period.
Sort by sessions or session change.
Match those URLs to your GSC loser list.
If GSC and GA4 disagree wildly, verify tracking first.
What percentage of traffic drops are caused by outdated content?
There is no universal percentage that fits every site. But High Visibility’s 2026 analysis concluded that roughly 80% of investigated drops traced back to AI Overviews or outdated content on specific pages. I’d use that as directional evidence, not as a hard forecasting model for your site.
Sources and references
• Google Developers explains how to debug search traffic drops and when to inspect specific pages: debugging search traffic drops
• Scalemee outlines a practical GSC workflow for finding declining pages with recent-period comparisons: finding pages losing traffic in GSC
• Surmado provides diagnostic framing for traffic-drop causes, including algorithm and technical shares: Google traffic drop diagnostic analysis
Final take
Here’s the thing: which pages caused my traffic drop? is not a mystery question. It’s a sorting question first, a pattern-recognition question second, and a fix question third.
Start with the pages losing the most clicks or sessions. Separate impression loss from CTR loss. Check measurement before blame. Inspect URLs before rewriting. Then decide whether the page needs a technical repair, a content refresh, or a strategic rethink.
If you’re using Nuwtonic, this process gets much faster because the platform already organizes your GSC data into the exact views that matter here: top movers, device gaps, zero-CTR pages, cluster patterns, and page-level audit guidance. That means less detective work, fewer false starts, and a much better chance of fixing the right pages first.