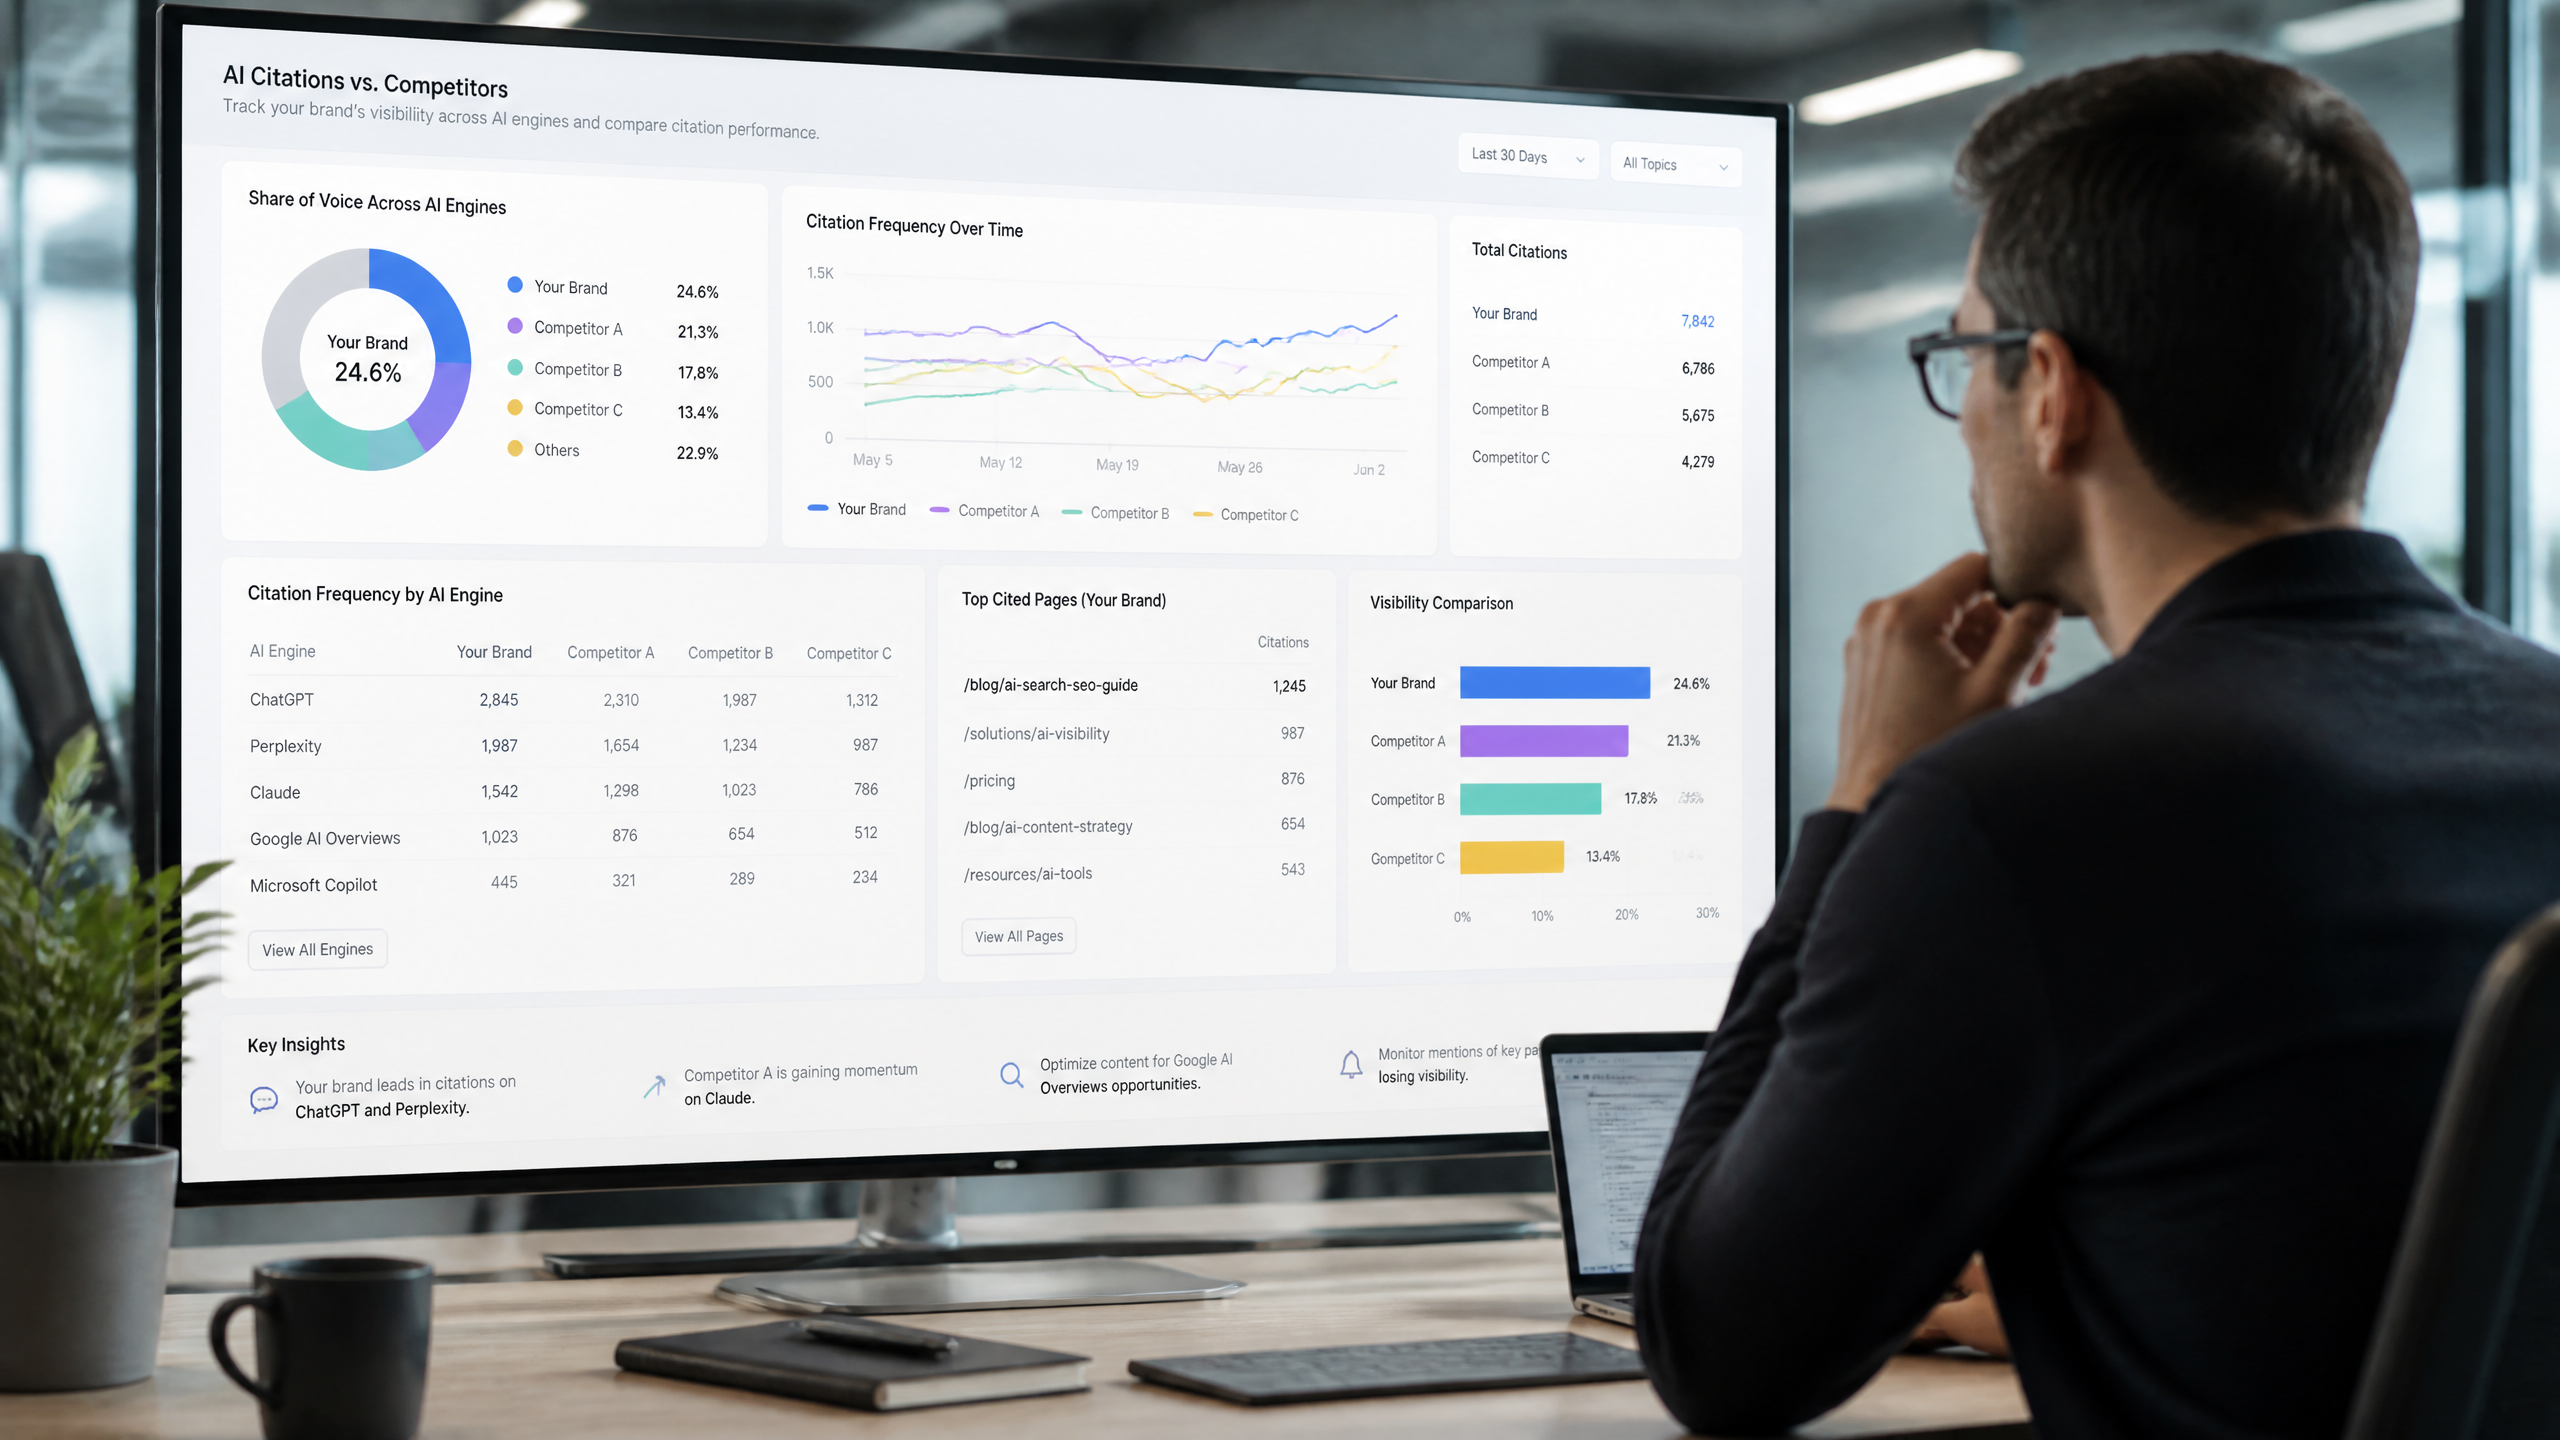
If you're asking How do I compare AI citations with competitors?, the short answer is this: use the same prompt set, test across the same AI engines, log citation frequency, position, context, and source types, then compare that data over time. The longer answer is where most teams get stuck. They collect too much messy data, define “citation” inconsistently, and end up with a spreadsheet that looks busy but says very little.
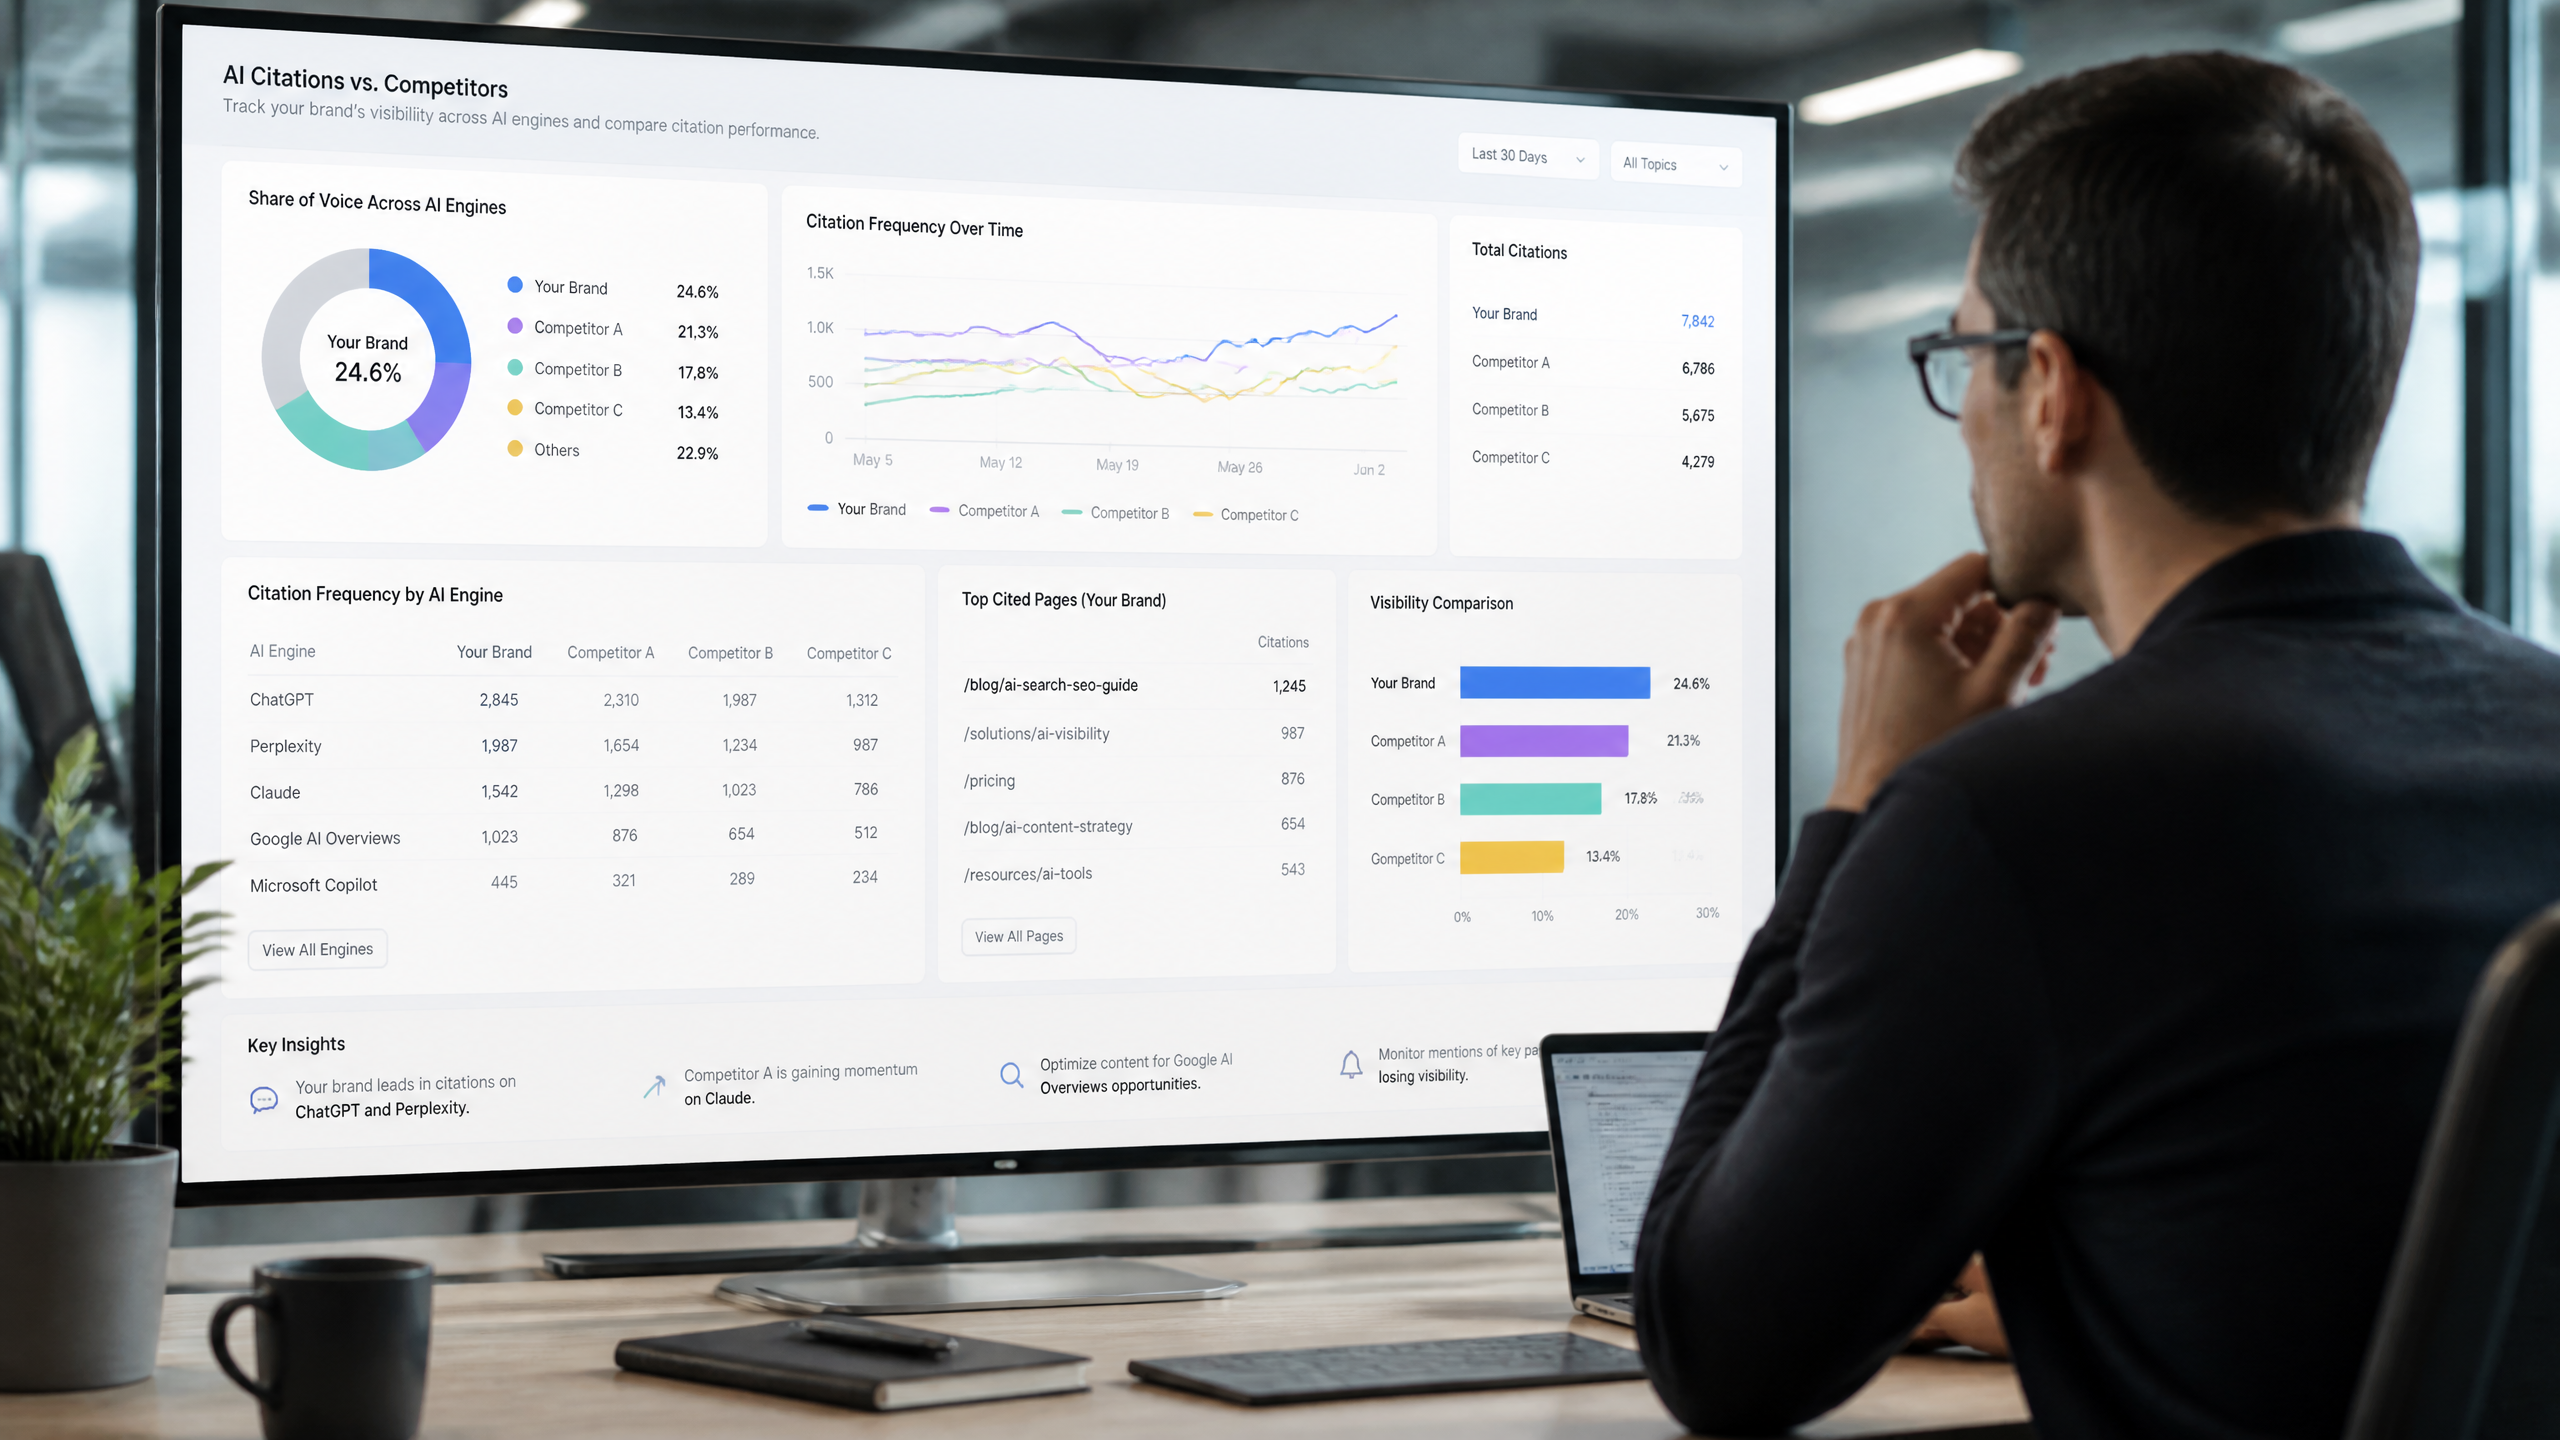
In my experience, many people overestimate the impact of citation volume; relevance often trumps quantity. If a competitor is mentioned first for high intent prompts and you are mentioned third on low intent prompts, your raw totals can look close while your competitive position is not. That distinction matters.
Nuwtonic is useful here because it narrows the workflow to the parts that actually affect AI visibility: prompt tracking, citation monitoring, share of voice analysis, competitor gap analysis, URL level gap detection, and AI search readiness fixes. It does not require you to stitch together rank tracking, manual prompt logs, and content audits across multiple systems just to answer one practical question.
TL;DR
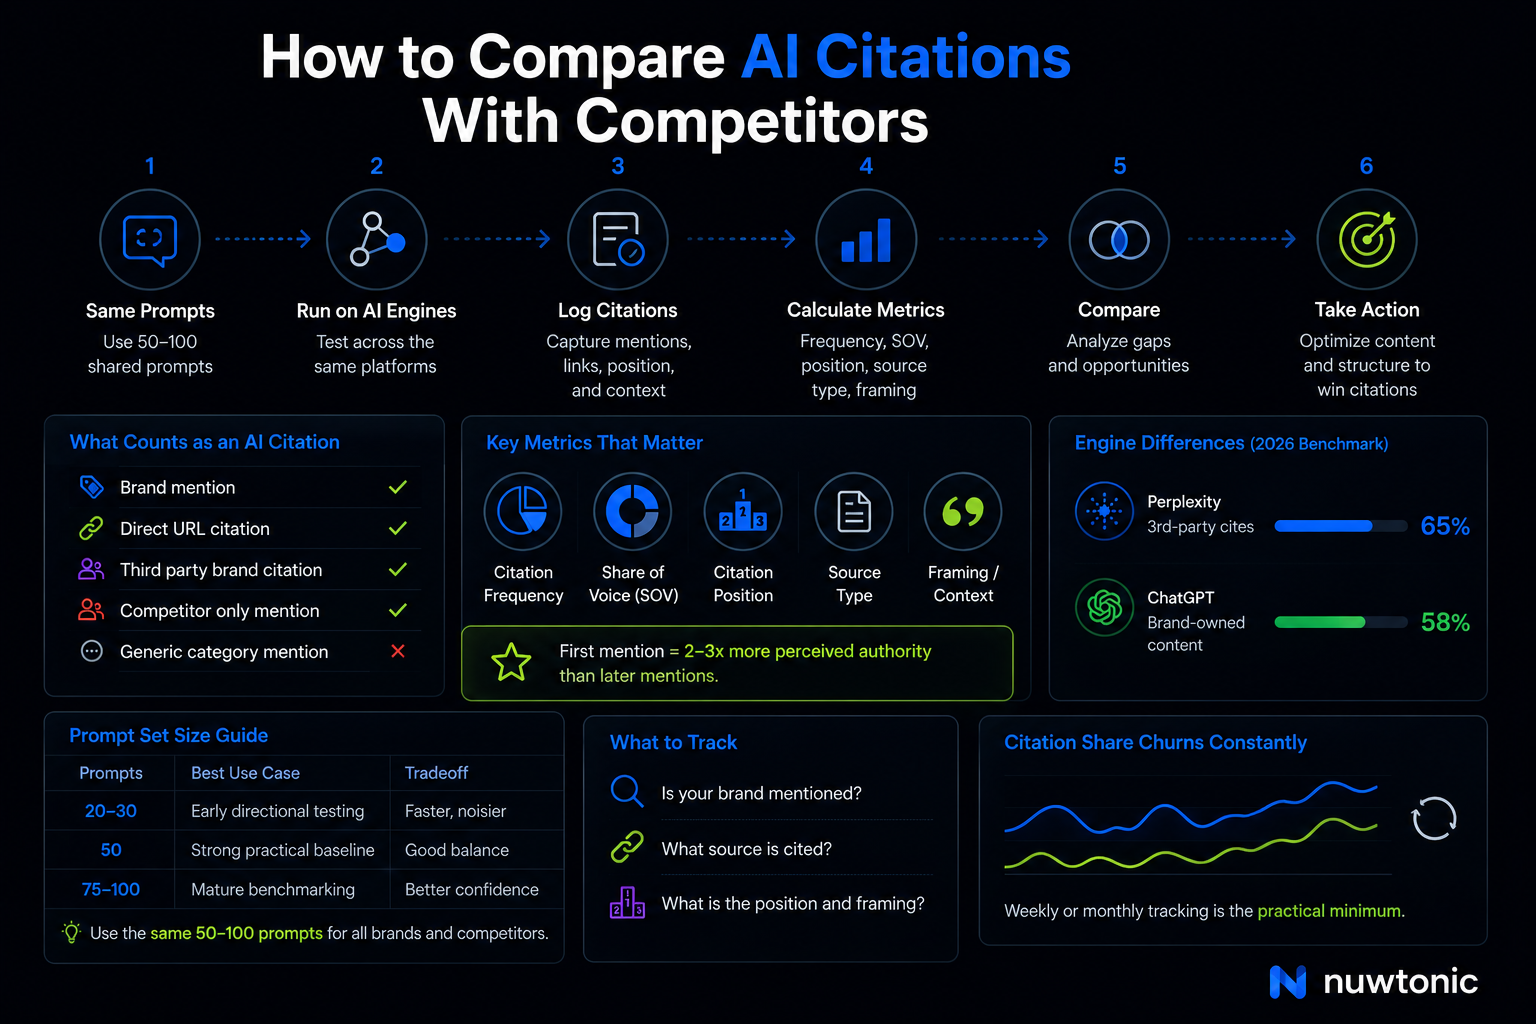
• Compare AI citations fairly by using the same 50 to 100 prompts across your brand and top competitors, which aligns with Competitive AI Search Benchmarking guidance in the research set.
• Track more than mentions. You need citation frequency, Share of Voice (SOV), citation position, source type, and framing.
• Research summarized from OptimizeGeo.ai shows the first mention acts like the de facto recommendation, with 2 to 3 times higher perceived authority than brands mentioned later.
• Research cited from AEOCanon indicates citation share churns constantly, so one snapshot is not enough. Weekly or monthly tracking is the practical minimum.
• Nuwtonic helps by monitoring prompts across AI platforms, showing whether your site is cited, where it ranks, what your SOV looks like, and where competitors are winning.
• When your site is absent, Nuwtonic’s citation gap analysis surfaces content gaps, structural gaps, E-E-A-T gaps, and competitor gaps at the URL level, then recommends what to add and where.
Key Takeaways
• A citation should be defined before you compare anything. Count whether the AI names your brand, cites your page, cites a third party about your brand, or all three.
• SOV is the core benchmarking metric: (your brand mentions ÷ total category mentions) × 100.
• Position matters almost as much as presence. A first mention on a transactional query is worth more than a buried mention on a broad informational prompt.
• Engine differences are real. Siftly.ai’s 2026 benchmark in the research set says Perplexity cites third party sources 65% of the time, while ChatGPT leans more on brand owned content at 58%.
• Content extractability affects citation rates. Metaflow.life’s 2025 findings in the research set reported 30% to 40% higher citation rates for structured formats such as tables and clear H2 and H3 hierarchies.
• Nuwtonic is strongest when you need to move from measurement to action without switching tools.
Table of Contents
What counts as an AI citation
The right way to compare citations with competitors
The metrics that actually matter
Where Nuwtonic fits into the workflow
A practical Nuwtonic workflow for competitor comparison
Common mistakes and what to avoid
Real scenarios and what they show
FAQ
Sources and references
What counts as an AI citation
Define the citation before you benchmark it
Here’s the thing: a lot of teams skip the definition step, and that breaks the whole analysis. A citation can mean several different things depending on the engine and the reporting method.
Citation type | What it means | Should you count it? | Why it matters |
|---|---|---|---|
Brand mention | The AI names your brand in the answer | Yes | Captures visibility even when no explicit source link appears |
Direct URL citation | The AI cites your domain or page | Yes | Best signal for source attribution and page level analysis |
Third party brand citation | The AI cites a review, news article, or forum discussing your brand | Yes | Shows off site authority and data provenance |
Competitor only mention | Rival brand appears but you do not | Yes | This is the core citation gap signal |
Generic category mention | AI mentions the category but no brands | Usually no | Useful for topic demand, not competitive citation share |
In my experience, the cleanest reporting model is to log three layers:
Was the brand mentioned?
What source was cited?
What was the position and framing?
That gives you enough signal for competitor analysis without turning the process into a research project that never ends.
Why a standardized prompt set matters
If you ask different questions for each brand, you are not benchmarking. You are storytelling.
The research summary attributes to Competitive AI Search Benchmarking guidance that you should test the same 50 to 100 queries across platforms for your brand and top 3 competitors. That is the closest thing this space has to a practical standard.
Prompt set size | Best use case | Tradeoff |
|---|---|---|
20 to 30 prompts | Early directional testing | Faster, but noisier and less stable |
50 prompts | Strong practical baseline | Good balance of speed and reliability |
75 to 100 prompts | Mature benchmarking program | Better confidence, more operational effort |
I generally recommend this split:
• 50 prompts if you are building your first repeatable benchmark
• 75 to 100 prompts if you operate across multiple product lines or local markets
• 20 to 30 prompts only if you need a quick diagnostic before a deeper run
Too often, teams get bogged down in data collection instead of focusing on actionable insights. Start with enough prompts to see patterns, not enough to create a reporting burden.
Choose competitors with a rule, not by instinct
A competitor set should not be “the brands leadership talks about in meetings.” It should be consistent.
Selection rule | When to use it | Limitation |
|---|---|---|
Search overlap | Best for SEO and AI citation benchmarking | May exclude offline market leaders |
Revenue or market share | Good for strategic reporting | Weak fit for SERP level competition |
Category intent overlap | Best for buyer journey analysis | Requires more manual classification |
Local market overlap | Best for local services | Can shift fast by geography |
Nuwtonic’s competitor gap section helps here because it identifies actual competitors by niche, maps keyword overlap, highlights quick wins, and flags what to target versus skip. That is particularly useful when your executive team and your search reality do not match.
The right way to compare citations with competitors
Build a standards first comparison model
A standards first model keeps your data comparable month to month.
Use one scoring sheet with these fields for every prompt and every engine:
Field | What to log | Why it matters |
|---|---|---|
Prompt | Exact user question | Makes reruns reproducible |
Intent stage | Informational, consideration, transactional | Shows where competitors dominate |
Engine | ChatGPT, Perplexity, Google AI Overviews, Gemini | Reveals engine specific gaps |
Brand cited | Your brand or competitor | Core frequency measure |
Position | 1st, 2nd, 3rd, not mentioned | Captures recommendation strength |
Source type | Brand page, review site, news, forum, directory | Exposes source dependence |
Citation context | Leader, option, alternative, niche fit | Adds authority framing |
Sentiment score | Positive, neutral, negative | Quantifies framing patterns |
Research from AEOCanon in the provided fact pack says four key data points must be logged per prompt: citation frequency per brand, engine specific citation patterns, source types cited, and the exact questions where competitors appear but you do not. I agree with that baseline, though I’d add position because first mention often changes the business impact.
Measure share of voice, not just total mentions
The Share of Voice formula is straightforward:
SOV = (Your brand’s AI mentions ÷ Total category AI mentions) × 100
That formula appears repeatedly in the research set, including Benchmarking and OptimizeGeo.ai references.
Brand | Mentions across prompt set | Total category mentions | SOV |
|---|---|---|---|
Your brand | 34 | 160 | 21.25% |
Competitor A | 52 | 160 | 32.5% |
Competitor B | 41 | 160 | 25.6% |
Competitor C | 33 | 160 | 20.6% |
This is where weak analyses usually fail. They stop at “we were cited 34 times.” Fine. But if the market produced 160 total category mentions, then your real story is 21.25% SOV. That is the metric executives understand.
Siftly.ai’s 2026 benchmark in the research set also makes an important point: citation rates vary significantly by industry, so fixed absolute targets are less useful than relative performance against your top 3 competitors. That tracks with what I’ve seen. I would not tell a B2B software brand and a local roofer to use the same benchmark target.
Weight citation position and context
You know what gets lost in dashboards? Position.
OptimizeGeo.ai’s 2025 benchmark, as summarized in the research, found that the first mention acts as the effective recommendation and carries 2 to 3 times higher perceived authority than lower mentions. That does not mean lower mentions are worthless, but it does mean simple frequency counts can mislead you.
Position | Suggested weight | Practical interpretation |
|---|---|---|
1st mention | 1.0 | Brand is the likely recommendation |
2nd mention | 0.6 | Strong visibility, weaker authority |
3rd mention | 0.4 | Present but less persuasive |
4th+ mention | 0.2 | Marginal competitive value |
Not mentioned | 0 | Citation gap |
I use weighted scoring because it reflects how people read AI answers. The first brand gets remembered. The rest get scanned.
You should also capture citation context. For example:
• “The market leader” = positive authority framing
• “A strong option for SMBs” = positive but narrower framing
• “An alternative” = lower authority framing
• “Can work in some cases” = weak or qualified framing
Per OptimizeGeo.ai in the research set, these descriptors can be converted into a sentiment score for comparison. If you need a practical rubric, use this:
Sentiment score | Meaning | Example |
|---|---|---|
2 | Positive | “Leading platform”, “top choice”, “trusted by” |
1 | Mild positive or neutral positive | “Strong option”, “good fit for SMBs” |
0 | Neutral | “One option among several” |
-1 | Qualified or weak | “Limited”, “best for narrow use cases” |
-2 | Negative | “Poor fit”, “frequently criticized” |
Compare across engines because each has source bias
Not all engines cite the same way. Research from Siftly.ai’s 2026 benchmark in your source pack reports that Perplexity cites third party sources 65% of the time, while ChatGPT relies more on brand owned content at 58%.
That means your competitor gap can look completely different by engine.
Engine | Source tendency from research | What to compare |
|---|---|---|
Perplexity | More third party sources | Reviews, news, directories, UGC coverage |
ChatGPT | More brand owned content | Blog quality, product pages, FAQs, documentation |
Google AI Overviews | Mixed, query dependent | SERP authority, structured content, local signals |
Gemini | Mixed, still variable | Cross check patterns, avoid overgeneralizing |
This depends heavily on your category. For local services, LocalBusiness schema and Google Business Profile completeness can matter a lot more. The Answer Engine AI’s 2025 analysis in the research set found businesses with LocalBusiness schema won 22% more citations than competitors without it for local search queries.
The metrics that actually matter
A practical scorecard for competitor comparison
If I were building a weekly or monthly review, this is the scorecard I would use.
Metric | Definition | Why it matters | Best cadence |
|---|---|---|---|
Citation frequency | Number of prompts where brand appears | Core visibility baseline | Weekly or monthly |
Share of Voice | Brand mentions divided by total mentions | Market ownership view | Weekly or monthly |
First mention rate | Percent of prompts where brand is mentioned first | Authority proxy | Weekly |
Sentiment score | Positive, neutral, negative framing | Brand positioning quality | Monthly |
Source diversity | Mix of brand, reviews, news, forums | Data provenance resilience | Monthly |
Gap count | Prompts where competitors appear but you do not | Action queue for optimization | Weekly |
AEOCanon’s guidance in the research says citation share churns constantly, so tracking cadence matters. LinkedIn’s 2026 ranking of AI citation tools, as summarized in the fact pack, recommends weekly tracking as the minimum to spot trends rather than one off fluctuations. I think that is right for active teams. If resources are tight, monthly can work, but weekly catches shifts sooner.
Map citation gaps to the buyer journey
One of the most useful things teams fail to do is classify prompts by intent stage.
Intent stage | Prompt example | What a citation gap means |
|---|---|---|
Informational | “What is AI SEO?” | Weak topical authority or poor explainers |
Consideration | “Best AI SEO tools for SMEs” | Competitors winning comparisons and recommendations |
Transactional | “Nuwtonic alternatives pricing” | Late stage visibility risk and conversion leakage |
Similarweb’s research in the fact pack recommends analyzing prompts by informational, consideration, and transactional intent so you can prioritize where to invest. That matters because not all citation gaps are equal.
If you miss an informational prompt, you lose awareness. If you miss a high intent comparison prompt, you may lose pipeline.
Evaluate source types and domain influence
Research from Similarweb and Metaflow.life in the provided set points to a recurring pattern: 60% of competitor citations often come from review, UGC, and news sites, while brands relying only on their blog miss that diversification.
Source type | Competitive value | What to do if competitors dominate here |
|---|---|---|
Brand owned blog | Good for foundational explanations | Improve extractability, refresh pages, add FAQs |
Product or service pages | Strong for direct relevance | Tighten positioning and structured sections |
Review sites | High trust for consideration prompts | Pursue listings, reviews, partner pages |
News articles | High authority and reach | Build PR and expert commentary coverage |
Forums or Reddit | Strong for practical comparisons | Monitor sentiment and participate where appropriate |
Many people chase sheer mention volume and ignore data provenance. That is a mistake. A mention from a high influence review domain can move more recommendation value than five low quality mentions scattered across weak sources.
Where Nuwtonic fits into the workflow
Nuwtonic solves the measurement problem without adding another spreadsheet
The most relevant Nuwtonic capability for this topic is its AI search visibility section.
You add the prompts you want to track, and Nuwtonic monitors:
• Whether your site is being cited
• Where you rank in AI results
• What your share of voice looks like
This is the core answer to How do I compare AI citations with competitors? inside Nuwtonic. You are not exporting raw fragments from different tools and trying to normalize them manually.
Problem in manual workflow | What Nuwtonic does | Why it matters |
|---|---|---|
Prompt tracking is inconsistent | Centralizes prompt monitoring across AI platforms | Keeps the benchmark standardized |
Citation checks are manual and slow | Tracks whether your site is cited for target prompts | Reduces lag between issue and diagnosis |
SOV is calculated in separate sheets | Surfaces share of voice in platform | Makes competitor visibility easier to read |
Teams do not know why they lost a citation | Runs citation gap analysis on the URL | Turns missing mentions into a fix list |
That matters because comparison without diagnosis is just reporting.
Nuwtonic helps explain why competitors are cited instead of you
This is where I think Nuwtonic is more useful than a simple monitoring tool. If your site is not showing up for a prompt, you can run a full citation gap analysis on the affected URL. Based on the knowledge base you provided, that includes:
• Content gaps
• Structural gaps
• E-E-A-T gaps
• Competitor gaps
That combination is exactly what AI citation comparison needs. You do not just want to know that a competitor appears in 32 out of 50 prompts while you appear in 18. You want to know why.
On one past project, we misjudged citations because we focused on volume and ignored structure. A competitor kept winning recommendation style prompts, and we assumed they had broader authority. They did not. They had better extractability: cleaner headings, comparison sections, and answer blocks. We lost weeks chasing the wrong fix. That is the type of missed opportunity a URL level gap analysis can prevent.
Nuwtonic turns findings into concrete fixes
Nuwtonic’s GEO Audit & Fix feature is relevant because AI citation comparison should not end with observation. It should produce implementation.
Citation problem | Likely underlying issue | Nuwtonic relevant capability |
|---|---|---|
Competitor cited, your page absent | Missing subtopics or weak topical coverage | Citation gap analysis |
Competitor cited from cleaner page structures | Low extractability | GEO Audit & Fix |
Competitor framed as leader | Weak trust signals or positioning clarity | E-E-A-T gap analysis |
Local competitor appears more often | Missing local schema or weak local page setup | AI readiness audit for local pages |
In my experience, basic metrics can provide a clearer picture than complex models for most use cases. The same goes for remediation. Start with the obvious page level fixes before trying to engineer a fancy ML scoring pipeline.
A practical Nuwtonic workflow for competitor comparison
Step 1: Build a clean prompt set
Create a prompt list grouped by buyer journey stage.
Informational prompts
Consideration prompts
Transactional prompts
A good starting structure looks like this:
Prompt group | Count | Goal |
|---|---|---|
Informational | 20 | Measure awareness level visibility |
Consideration | 20 | Measure comparison and shortlist presence |
Transactional | 10 | Measure bottom funnel recommendation strength |
That gives you a 50 prompt baseline, which aligns with the lower end of the research backed recommendation range.
Step 2: Track prompts in Nuwtonic’s AI search visibility section
Add those prompts into Nuwtonic and monitor:
• Whether your site is cited
• Which prompts produce visibility
• Your share of voice pattern
• Which prompts show no presence
This is where you begin your three way comparison in practice: your brand plus 2 to 3 actual competitors across the same query themes.
Step 3: Isolate the citation gaps that matter most
Do not treat all gaps equally. Prioritize by intent and business value.
Gap type | Priority level | Why |
|---|---|---|
Transactional prompt gap | Very high | Closest to revenue impact |
Consideration prompt gap | High | Affects shortlist inclusion |
Informational prompt gap | Medium | Important for authority building |
Low relevance prompt gap | Low | Often not worth immediate effort |
TryAnalyze.ai’s methodology in the research pack recommends logging citation gaps by prompt and content type so you can see whether AI prefers a competitor’s review page, product page, or forum mention. That is a smart move because the fix depends on the source pattern.
Step 4: Run URL level gap analysis in Nuwtonic
For prompts where competitors are cited and you are not, run Nuwtonic’s URL analysis to surface:
• Missing topics
• Missing structure
• Missing trust signals
• Competitor coverage advantages
This is the step most teams try to do manually with ten tabs open. It is slow, and people inevitably miss patterns.
Step 5: Apply fixes with GEO Audit & Fix
Use Nuwtonic’s audit and fix capabilities to improve AI search readiness on the specific URLs that matter.
Research summarized from Metaflow.life found that pages using tables and stronger H2 and H3 hierarchies saw 30% to 40% higher citation rates than prose heavy competitors. That does not mean every page needs tables everywhere, but it does mean formatting is not cosmetic. It affects extraction.
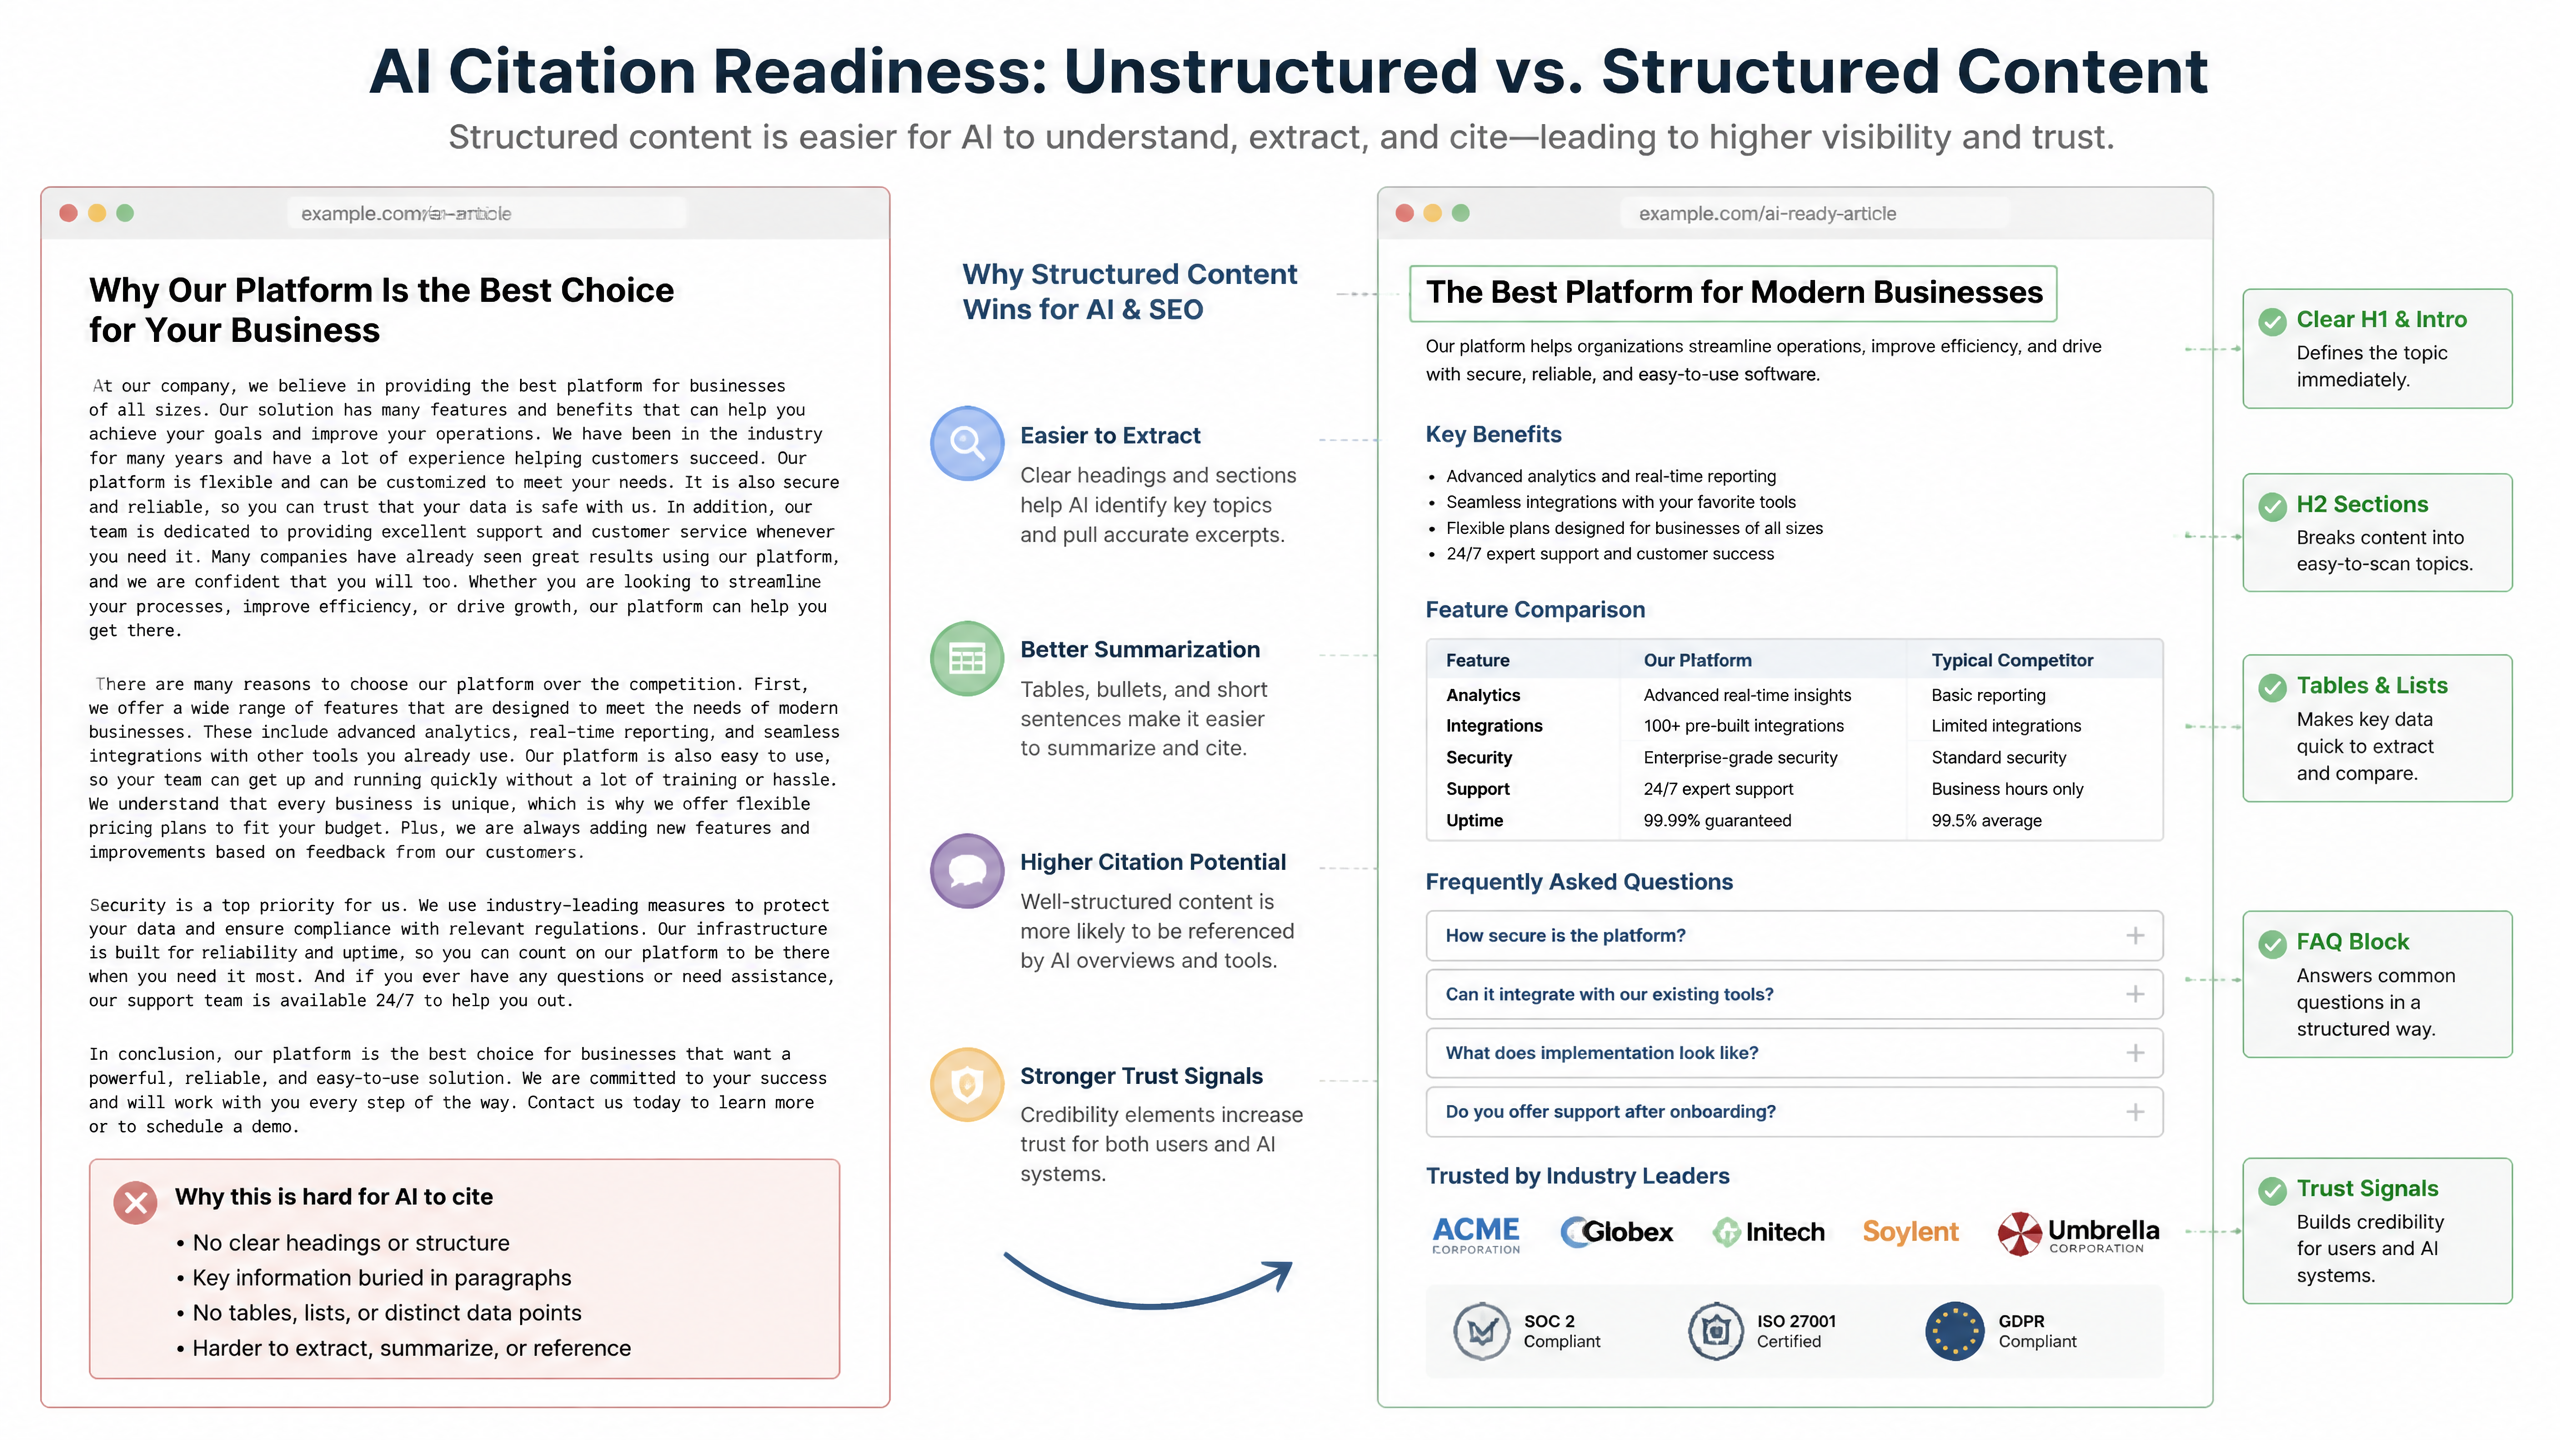
A practical fix list often includes:
Clear answer blocks near the top of the page
Better H2 and H3 sectioning
Comparison tables where users expect them
Definitions and summaries in plain language
Trust signals that support E-E-A-T
Step 6: Re test on a regular cadence
AEOCanon’s and LinkedIn’s benchmark references in the research both support regular retesting, with weekly as the minimum practical cadence and monthly useful for stability checks. Metaflow.life’s methodology also notes 2 to 3 week lag times after content reformats before improvements stabilize.
So the workflow is simple:
Measure
Diagnose
Fix
Re test
Compare trend lines, not single snapshots
Common mistakes and what to avoid
Mistake 1: Treating all citations as equal
A first place mention on a “best tools” prompt is not equal to a passing mention on a broad educational query.
Mistake | Why it fails | Better approach |
|---|---|---|
Count all mentions equally | Hides authority differences | Weight by position and intent |
Ignore source type | Misses off site influence gaps | Track review, news, UGC, brand pages |
Use one time snapshots | Confuses churn with trend | Use weekly or monthly cadence |
Mistake 2: Testing too few prompts or changing them each run
Fair warning: if your prompt set changes every month, your trend line is compromised.
Use a stable core set, then rotate a smaller experimental set if needed.
Prompt strategy | Reliability | Recommendation |
|---|---|---|
New prompts every run | Low | Avoid |
Fixed core prompts only | High | Best for trend tracking |
Fixed core plus rotating experimental set | High to medium | Best for mature programs |
Mistake 3: Over automating without checking bias
The research set correctly flags a real issue: browser automation tools such as Puppeteer and Selenium can introduce bias, and platform rules or privacy constraints may apply. Responses can differ by browser fingerprint, rate limiting, or session context.
I am slightly skeptical of teams that try to automate everything from day one. Automation is useful, but only after you have a clean methodology. Otherwise you scale noise.
Mistake 4: Focusing only on your site, not the sources around it
If competitors are being cited through review sites, news articles, and local listings while you are relying only on owned blog content, you are probably underexposed.
Research from Similarweb and Metaflow.life in the provided pack suggests this gap is common, with 60% of competitor citations often coming from review, UGC, and news sources. That should shape your remediation priorities.
Real scenarios and what they show
Scenario 1: Local business closes a local citation gap
One pattern I keep seeing is local businesses assuming their service pages are enough. They are not always enough.
In the research set, a home renovation company tested 50 prompts across ChatGPT, Perplexity, and Google AI Overviews. A competitor appeared in 32 out of 50 prompts, or 64% citation rate, while they appeared in 18 out of 50, or 36%. After adding LocalBusiness schema and expanding FAQ pages, their citation rate rose to 48% in 3 weeks, while the competitor dropped to 58%.
The lesson is not just “add schema.” The lesson is that local citation gaps often combine technical structure and content clarity. Nuwtonic is relevant here because it can flag the gap and point the team toward the specific URL level readiness issues rather than leaving them to guess.
Scenario 2: B2B software brand finds the wrong source mix
Here’s the thing about SaaS teams: they often publish plenty of content and still lose recommendation prompts because their source diversity is weak.
The research set includes a B2B software vendor that used AI visibility benchmarking and found 60% of competitor citations came from news and review sites, while only 20% of theirs did. They targeted 5 high influence review sites and saw a 25% increase in citation share within 2 months.
That is a classic data provenance problem. The brand had content. It did not have enough external corroboration. Nuwtonic’s competitor gap analysis is useful here because it helps reveal where competitors are winning, so your team can decide whether the fix belongs on page, off page, or both.
Scenario 3: Retail brand improves extractability instead of chasing volume
A pet supply brand in the research set logged citation gaps by buyer journey stage and found that in consideration prompts, a competitor was cited 15 times versus the brand’s 3. After reformatting pages into comparison tables and matching the competitor’s extractability signature, they increased their citation count to 12 in 4 weeks.
I like this example because it shows a recurring truth: teams often think they need more content when they actually need more extractable content.
I saw a similar pattern in a past project where we misread the market. We assumed the competitor’s advantage came from broader topical authority. It turned out their pages were simply easier for AI systems to parse and reuse. We missed that signal and lost time chasing net new content instead of fixing structure.
FAQ
How do I calculate citation frequency versus competitors?
Build a fixed prompt set, ideally 50 to 100 prompts based on the research guidance.
Run the same prompts across the same engines for your brand and top competitors.
Count how many prompts mention each brand.
Break results down by intent stage and engine.
Brand | Prompts tested | Prompts cited | Citation frequency |
|---|---|---|---|
Your brand | 50 | 18 | 36% |
Competitor A | 50 | 32 | 64% |
Competitor B | 50 | 25 | 50% |
Nuwtonic simplifies this by tracking prompt level citation visibility directly in its AI search visibility workflow.
What is the best way to measure Share of Voice in AI responses?
Use the standard formula:
SOV = (Your brand mentions ÷ Total category mentions) × 100
That lets you compare market ownership rather than isolated counts.
Does citation position really matter?
Yes. Research summarized from OptimizeGeo.ai says the first mention can deliver 2 to 3 times higher perceived authority than lower mentions. If your competitor is usually first and you are usually third, raw frequency can hide the problem.
How many prompts do I need for reliable comparison?
There is no universal statistical standard yet, which is one of the field’s real gaps. Practically:
• 20 to 30 prompts gives directional insight
• 50 prompts is a solid working baseline
• 75 to 100 prompts is stronger for mature programs
Your mileage may vary by category breadth and query volatility.
How often should I rerun competitive citation tests?
Weekly is the best minimum for active monitoring, based on the research summary from LinkedIn’s 2026 tool ranking and AEOCanon’s churn guidance. Monthly is acceptable when resources are limited or when you are measuring after a content change.
How do I know whether a citation decline is real or just churn?
Compare at least 3 to 4 time periods before reacting. If declines appear only in one engine or one query cluster, it may be noise. If they persist across the same prompt group and competitor set, it is more likely a true shift.
What should I do if competitors are cited from review sites instead of their own pages?
Treat that as a source mix gap. Research in the fact pack suggests competitor citations often come heavily from review, UGC, and news sources. The fix may involve outreach, listings, reviews, or PR rather than just rewriting your page.
Can Nuwtonic fix every part of competitive AI citation analysis?
No tool fixes everything, and I would be wary of saying otherwise. Nuwtonic is most relevant for this topic when you need to:
• Track prompt level AI citation visibility
• Monitor share of voice
• Find competitor citation gaps
• Diagnose URL level content, structure, and E-E-A-T issues
• Apply AI search readiness improvements through audit and fix workflows
If your main issue is broad off site reputation building, you will still need a wider visibility strategy beyond on site optimization.
Conclusion
So, How do I compare AI citations with competitors? Use a repeatable framework: a fixed prompt set, shared engines, clear citation definitions, weighted position analysis, source type logging, and regular cadence tracking. Then act on the gaps that affect revenue, not just the ones that make a chart look dramatic.
Nuwtonic is well suited to this exact problem because it brings the tracking, citation gap analysis, competitor visibility comparison, and AI readiness fixes into one workflow. That matters more than people realize. The operational problem in AI visibility is rarely a lack of data. It is the delay between spotting a gap and knowing what to change.
If your team is tired of comparing citations in one tool, auditing pages in another, and managing fixes in a spreadsheet, Nuwtonic gives you a more direct path: measure the gap, understand the cause, and improve the pages that AI systems actually choose to cite.
Sources and References
• Competitive AI Search Benchmarking guidelines cited in the research brief
• OptimizeGeo.ai 2025 benchmark findings cited in the research brief
• AEOCanon citation churn and cadence guidance cited in the research brief
• Metaflow.life 2025 structured formatting and extractability findings cited in the research brief
• Similarweb AI Brand Visibility and citation source pattern findings cited in the research brief
• The Answer Engine AI 2025 LocalBusiness schema findings cited in the research brief
• TryAnalyze.ai prompt and content type gap logging guidance cited in the research brief
• Siftly.ai 2026 benchmark and engine source tendency findings cited in the research brief
Note on methodology: Public standards for AI citation benchmarking are still immature. I’ve intentionally used a standards first framework grounded in the research provided, while being careful not to overstate precision where the industry still lacks consensus.